Government
· Research communications
Adobe: Digital Government Index
From
From: An 80-page report
From: An 80-page report
From: An 80-page report
From: An 80-page report
To
A 15-minute meeting with a state CIO
Client
Adobe
Adobe
Agency
Sage Communications
Sage Communications
My role
Creative direction
Creative direction
Years
2024
2024
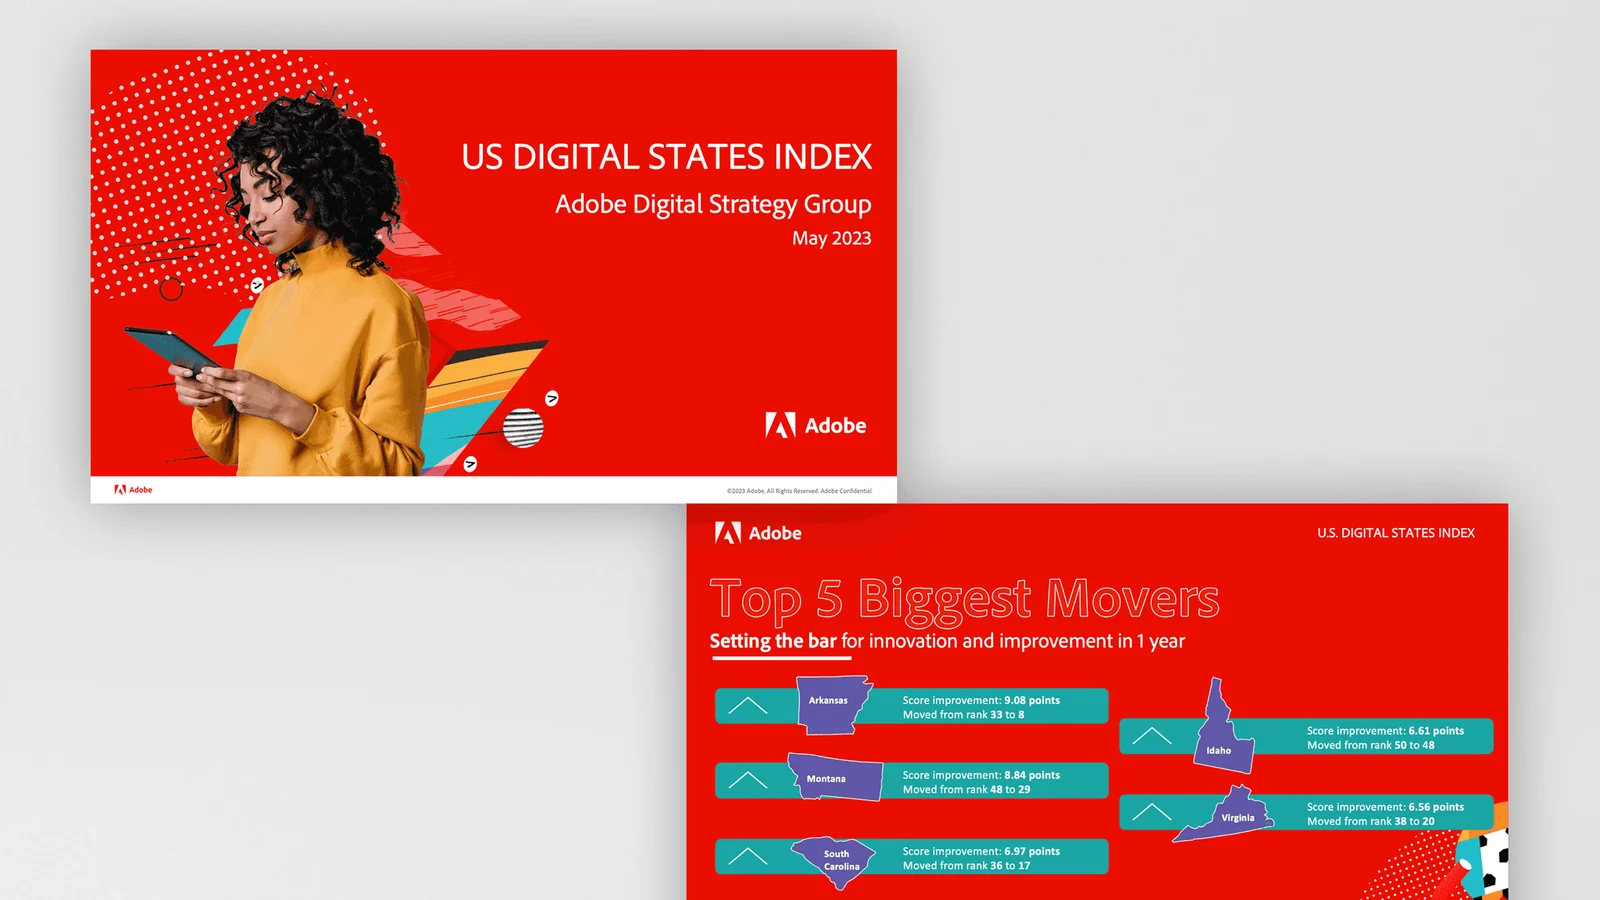
Fig. 01
Cover of the Digital Government Index materials.
01
The gap
The gap
Adobe measured how well U.S. state and local governments deliver digital services, and the research was rigorous. But state CIOs, city managers and government technology leaders don’t read 80-page reports at their desks. They scan handouts at conferences and flip through decks between meetings.
Adobe measured how well U.S. state and local governments deliver digital services, and the research was rigorous. But state CIOs, city managers and government technology leaders don’t read 80-page reports at their desks. They scan handouts at conferences and flip through decks between meetings.
On one side
Adobe, with a rigorous index of state and local government digital services
On one side
Adobe, with a rigorous index of state and local government digital services
On the other
State CIOs and city managers with 15 minutes between conference sessions
On the other
State CIOs and city managers with 15 minutes between conference sessions


02
The translation
The translation
The idea that crossed
Rebuild the research for the rooms where decisions get made.
The idea that crossed
Rebuild the research for the rooms where decisions get made.
What we made
A presentation that works as a briefing and a leave-behind
Two-page overviews for conferences and one-on-ones
A blog post
A cities and counties edition in the same design language
The presentation turned the full report into one story: findings, then what they mean, then next steps. Adobe’s government team could walk into any meeting and make the case without the report. The two-page overviews were short enough to read before a panel starts and polished enough to hand to a CIO.
What we made
A presentation that works as a briefing and a leave-behind
Two-page overviews for conferences and one-on-ones
A blog post
A cities and counties edition in the same design language
The presentation turned the full report into one story: findings, then what they mean, then next steps. Adobe’s government team could walk into any meeting and make the case without the report. The two-page overviews were short enough to read before a panel starts and polished enough to hand to a CIO.
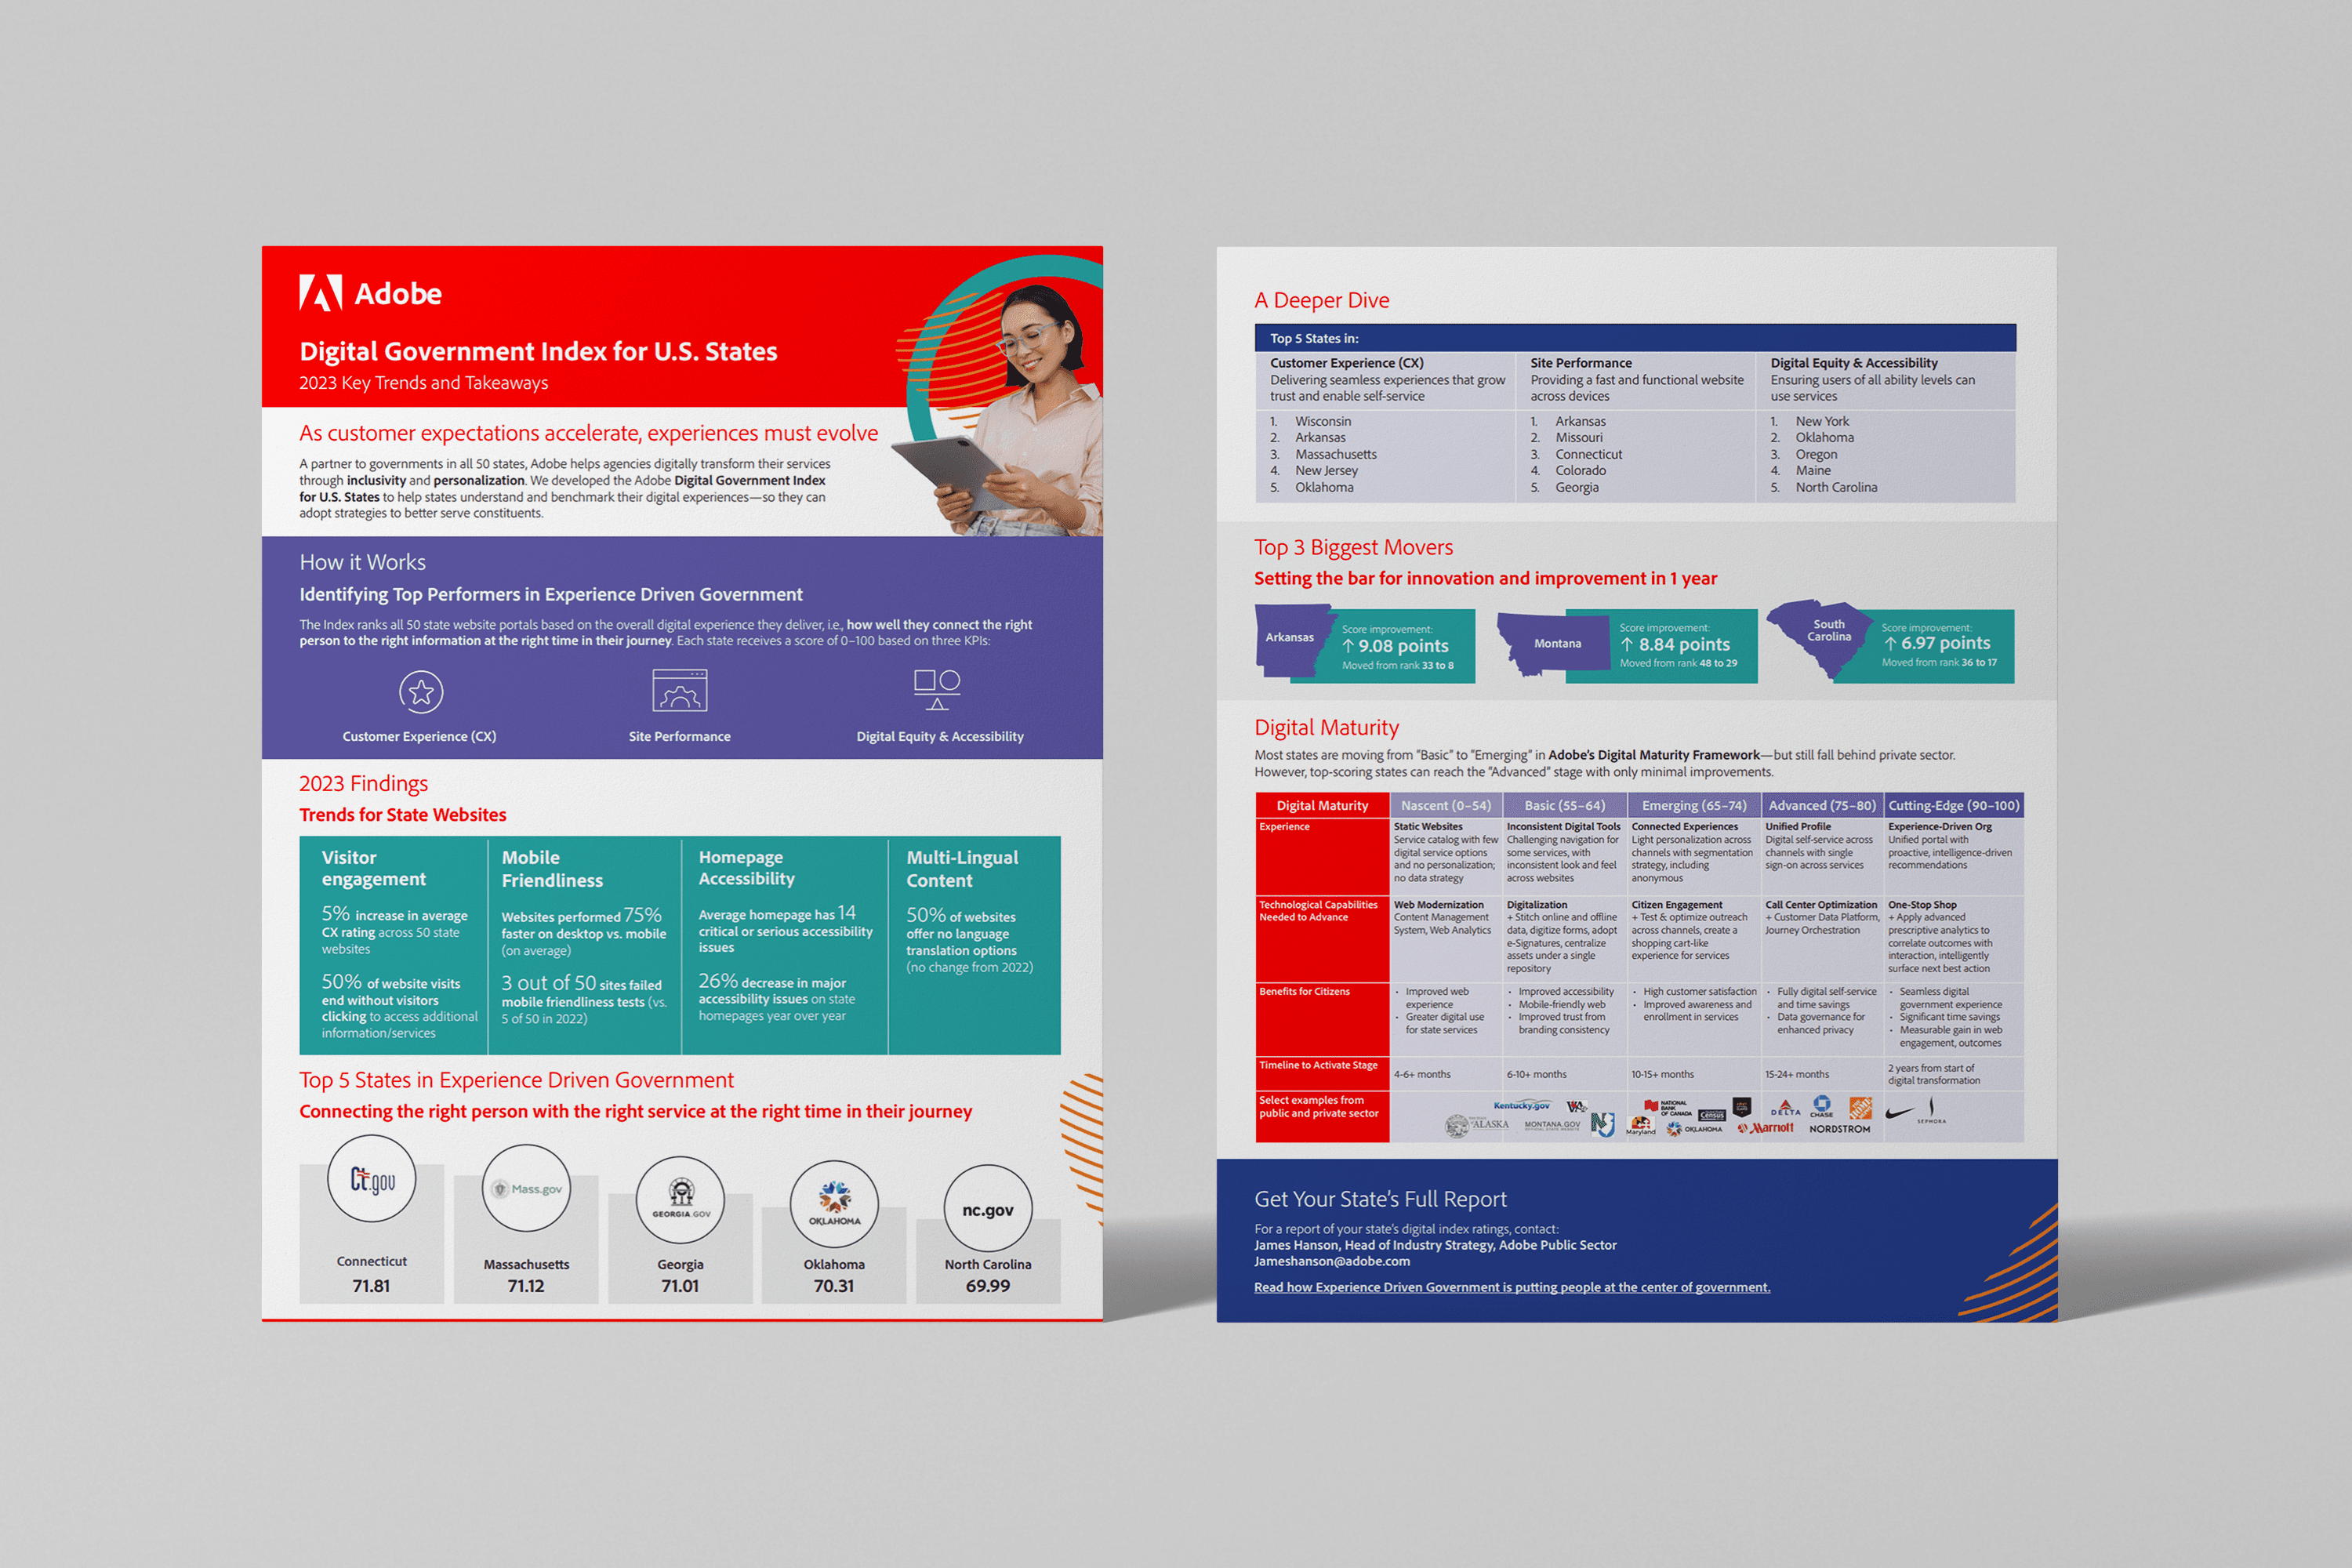
Fig. 02
A two-page overview.
Fig. 02
A two-page overview.
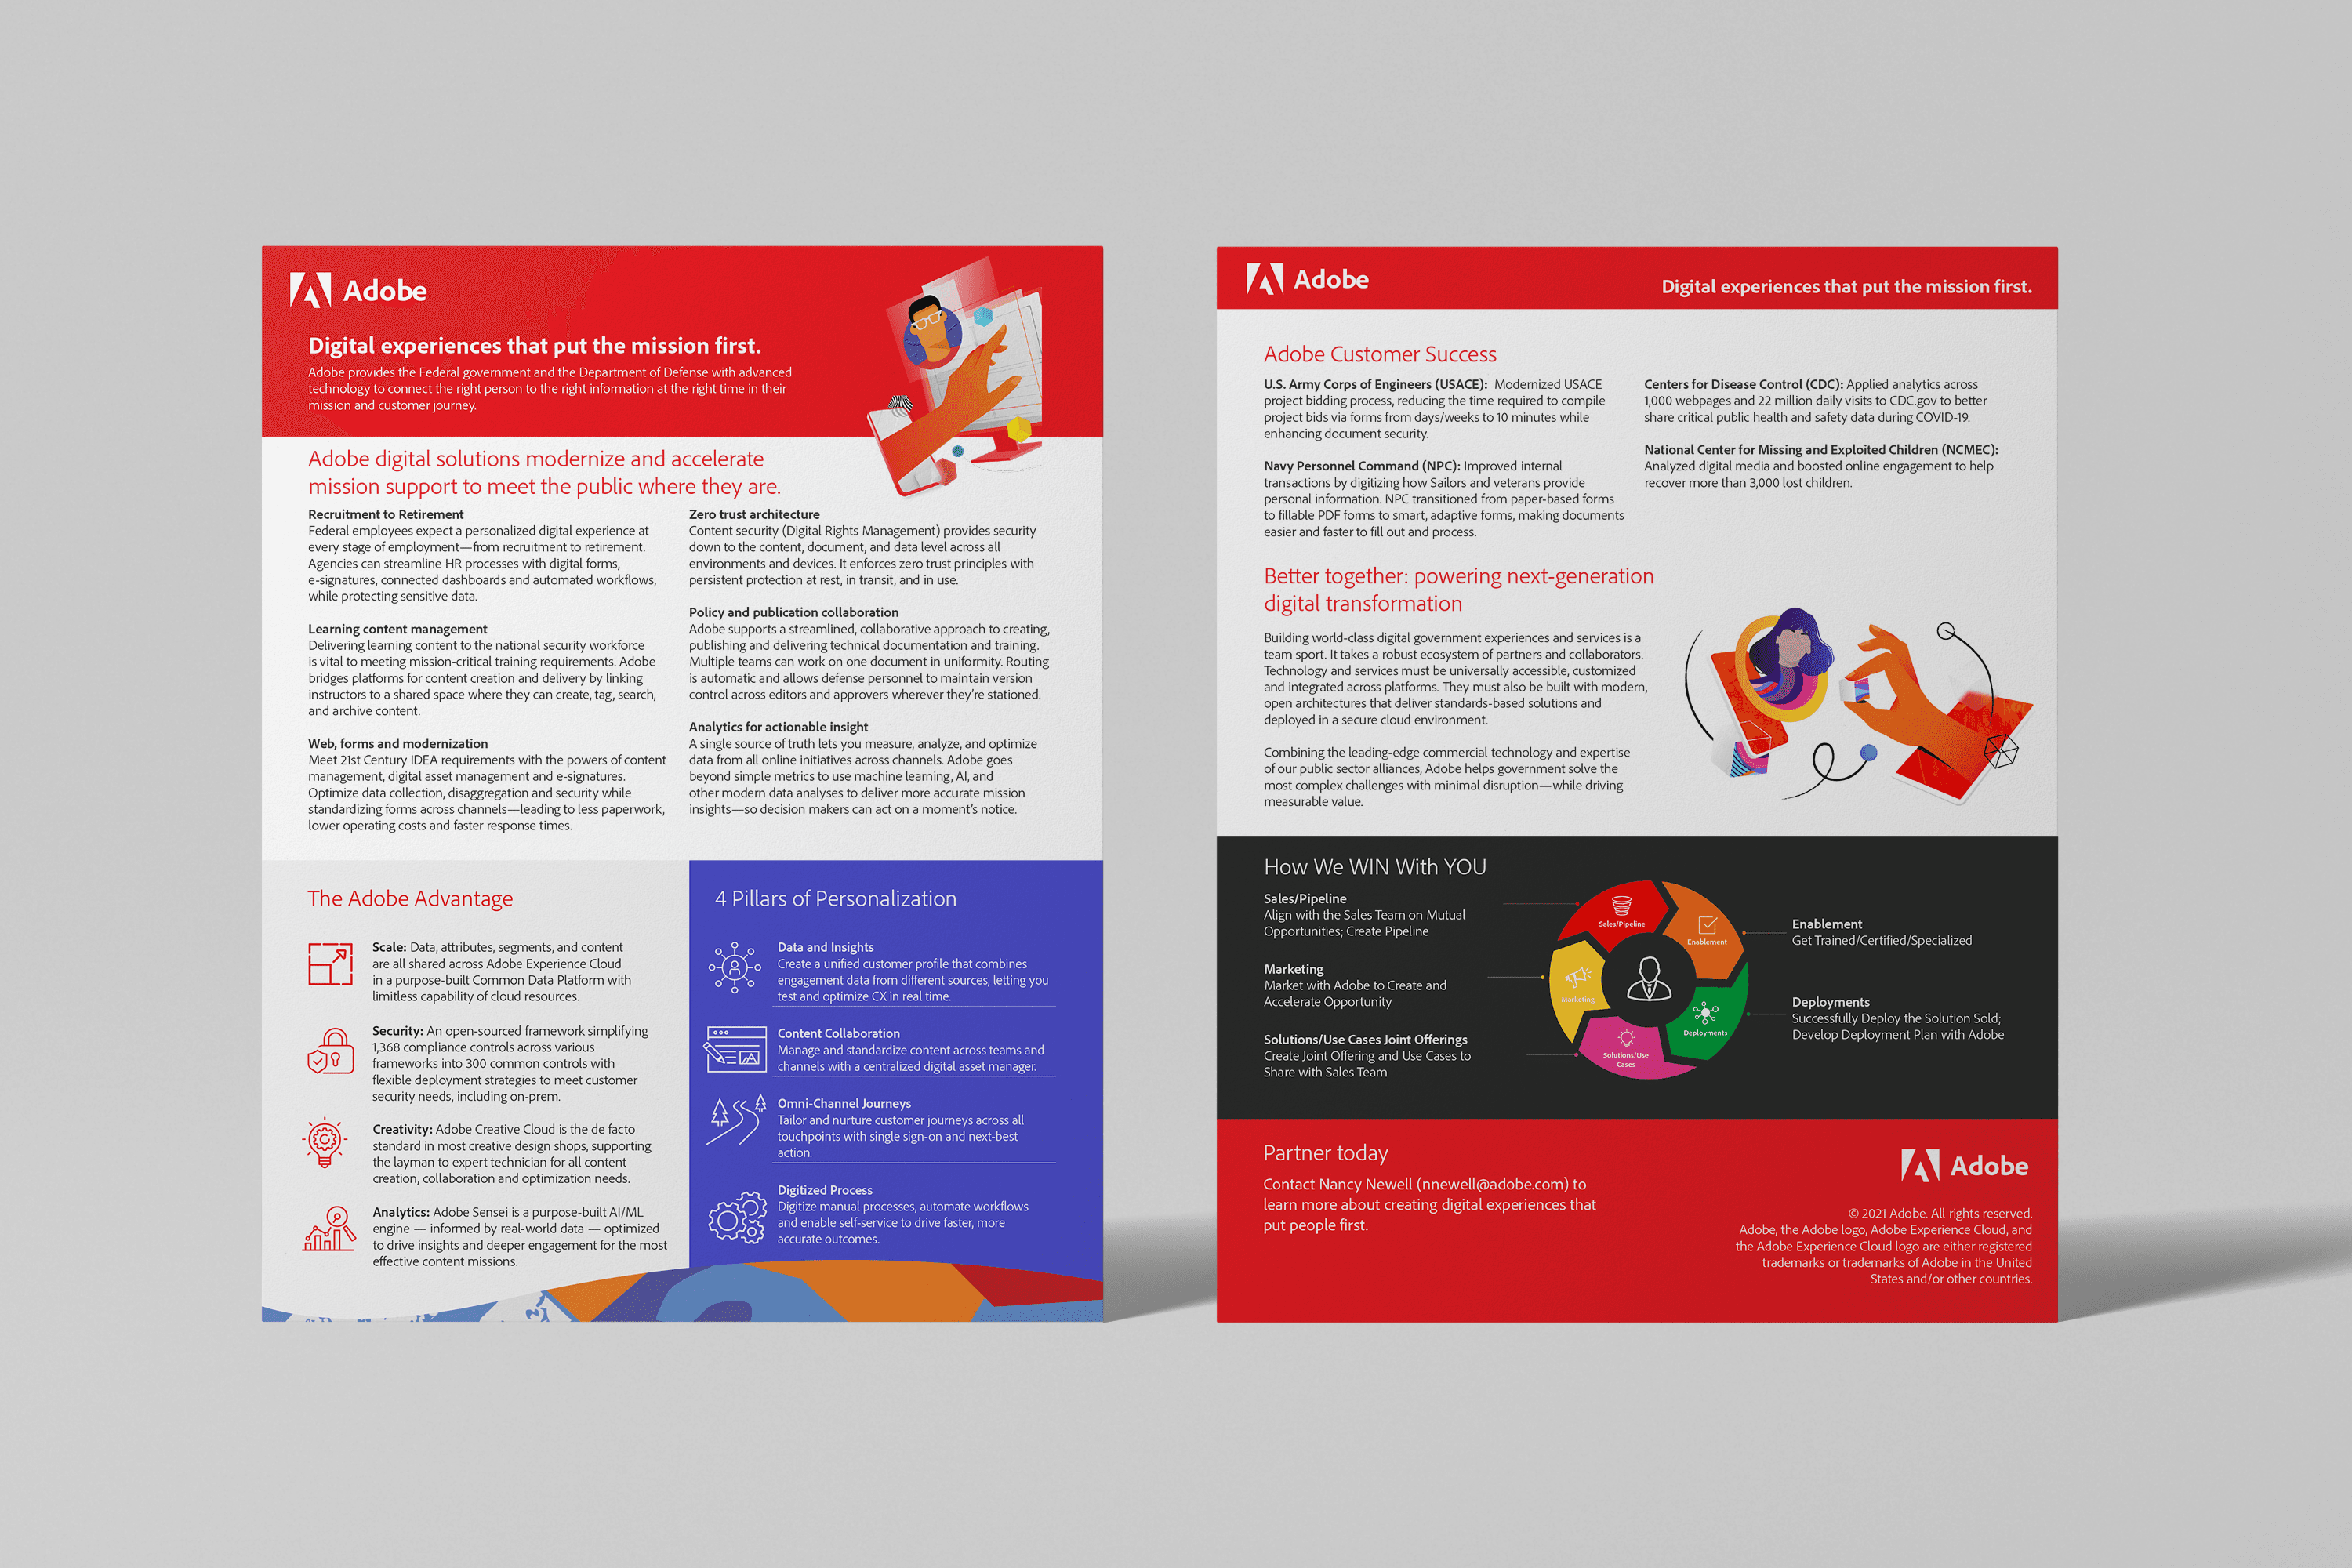
Fig. 03
A two-page overview.
Fig. 03
A two-page overview.
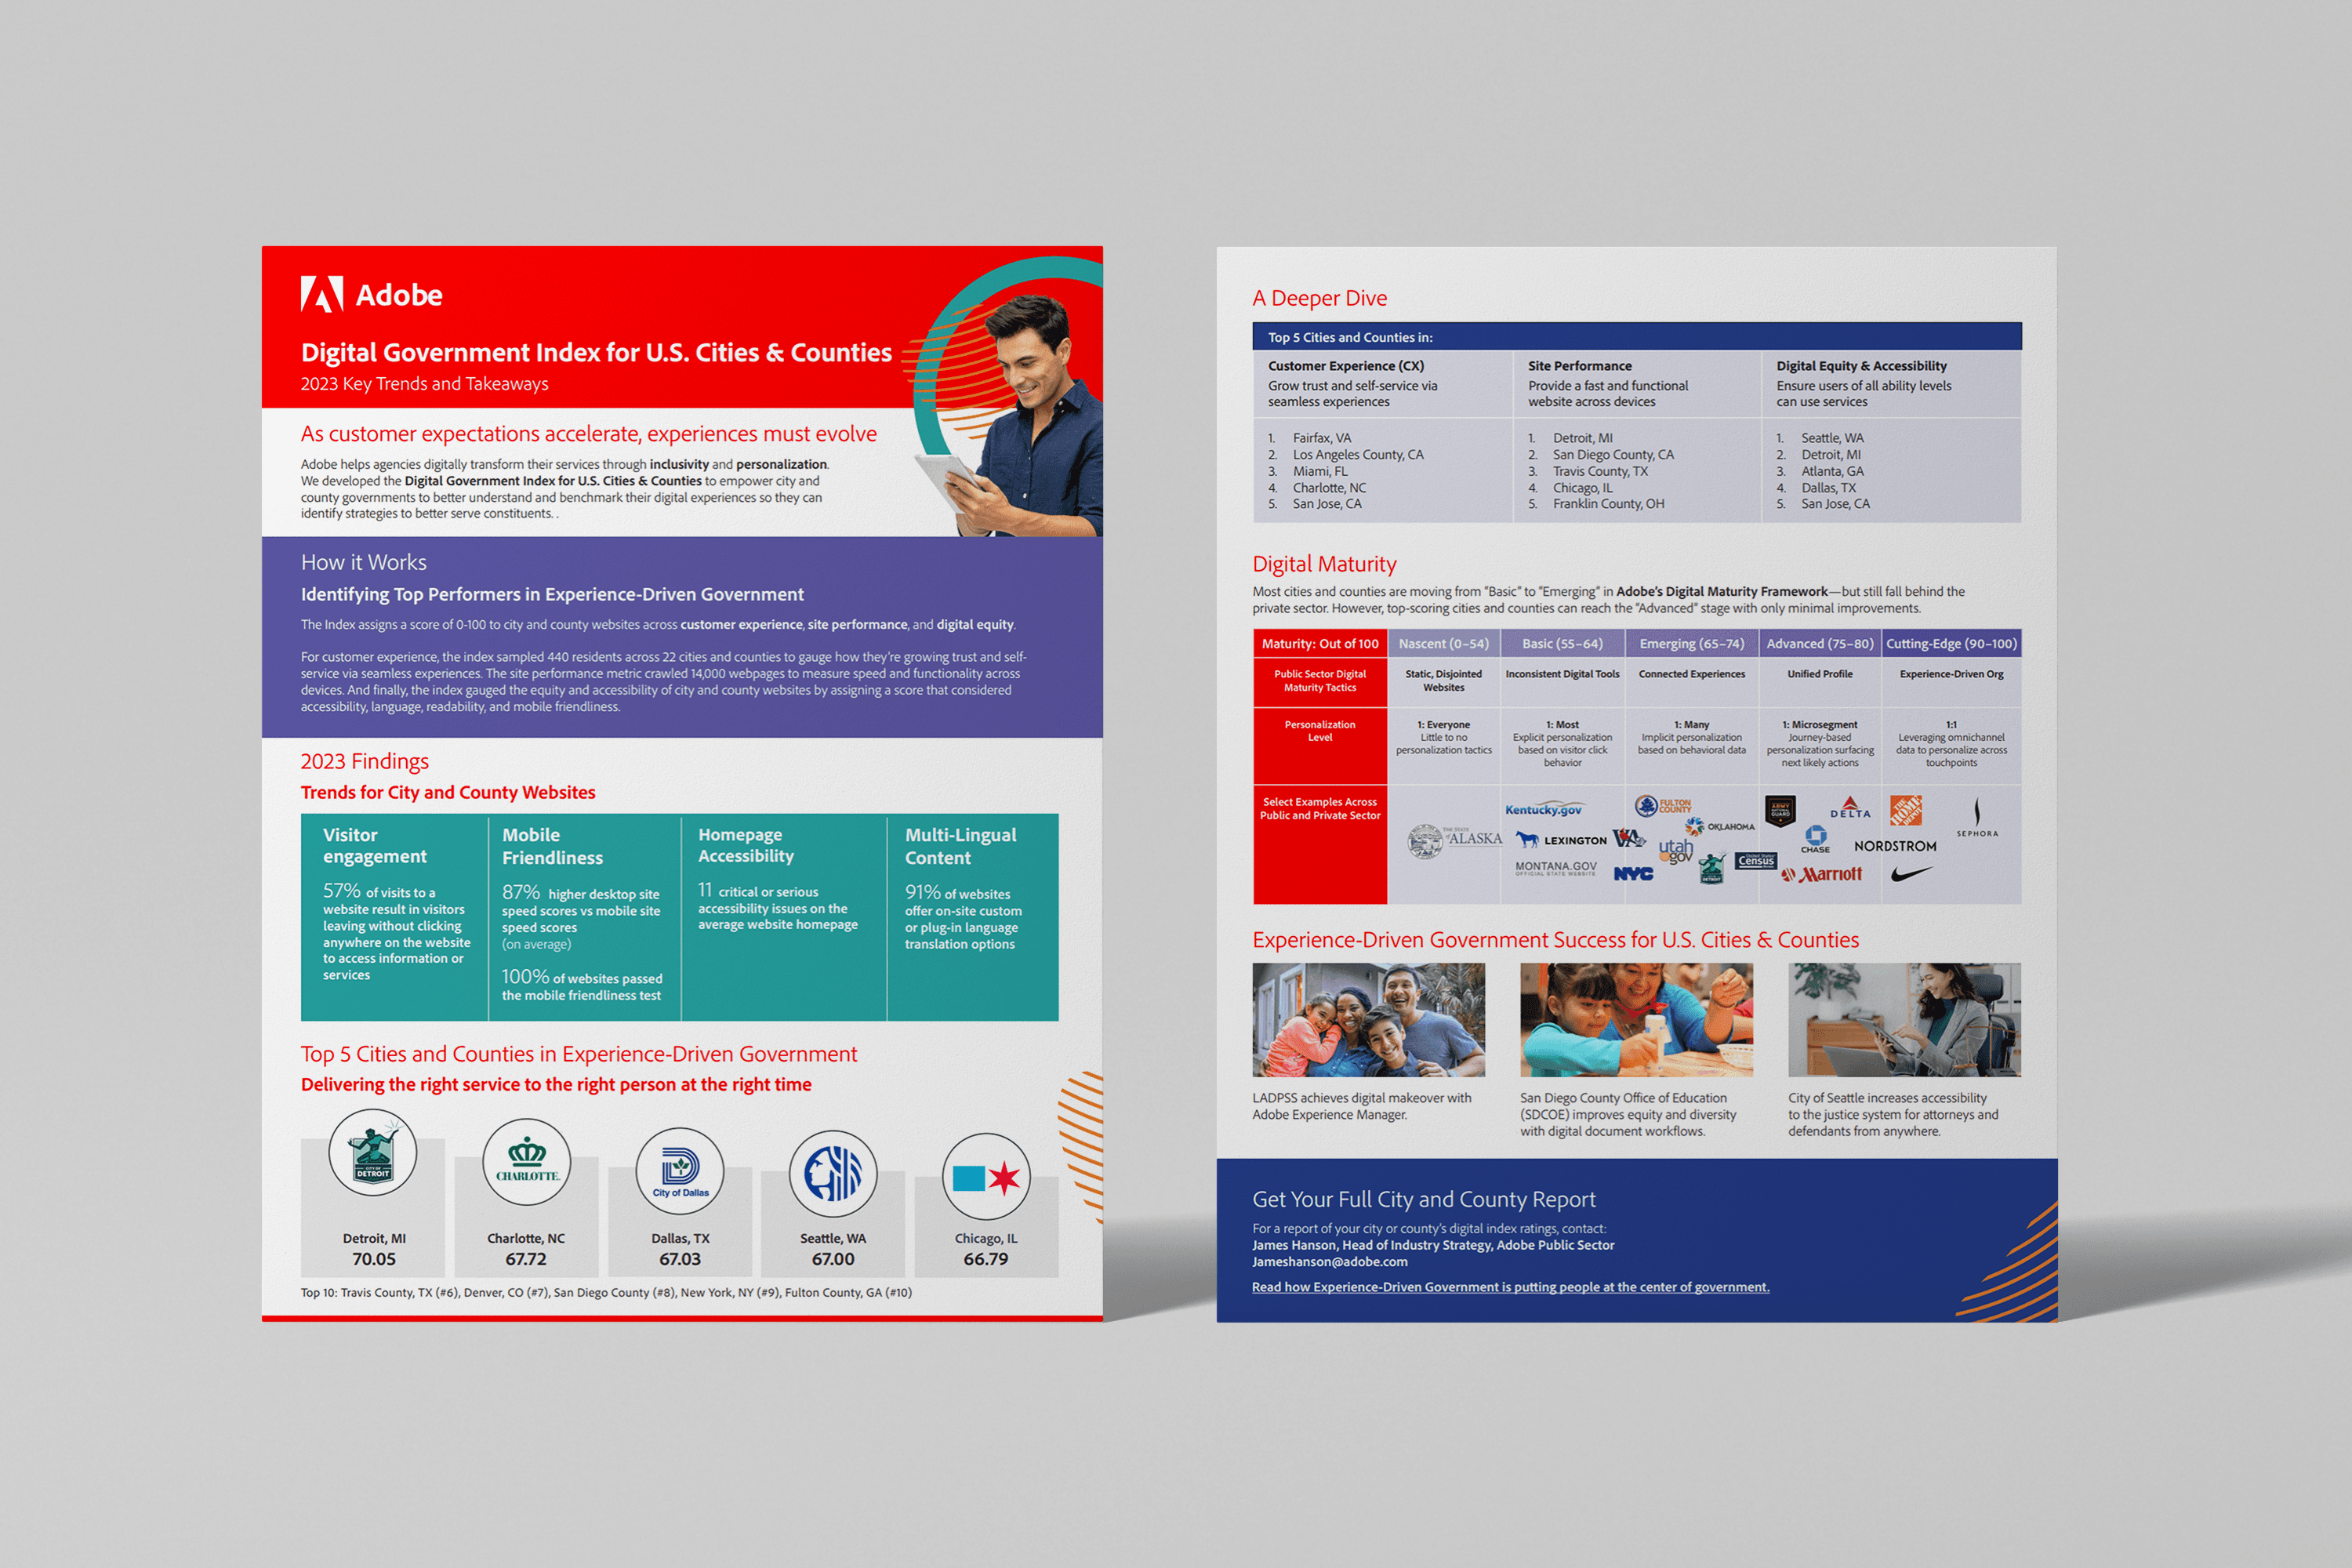
Fig. 04
A two-page overview.
Fig. 04
A two-page overview.
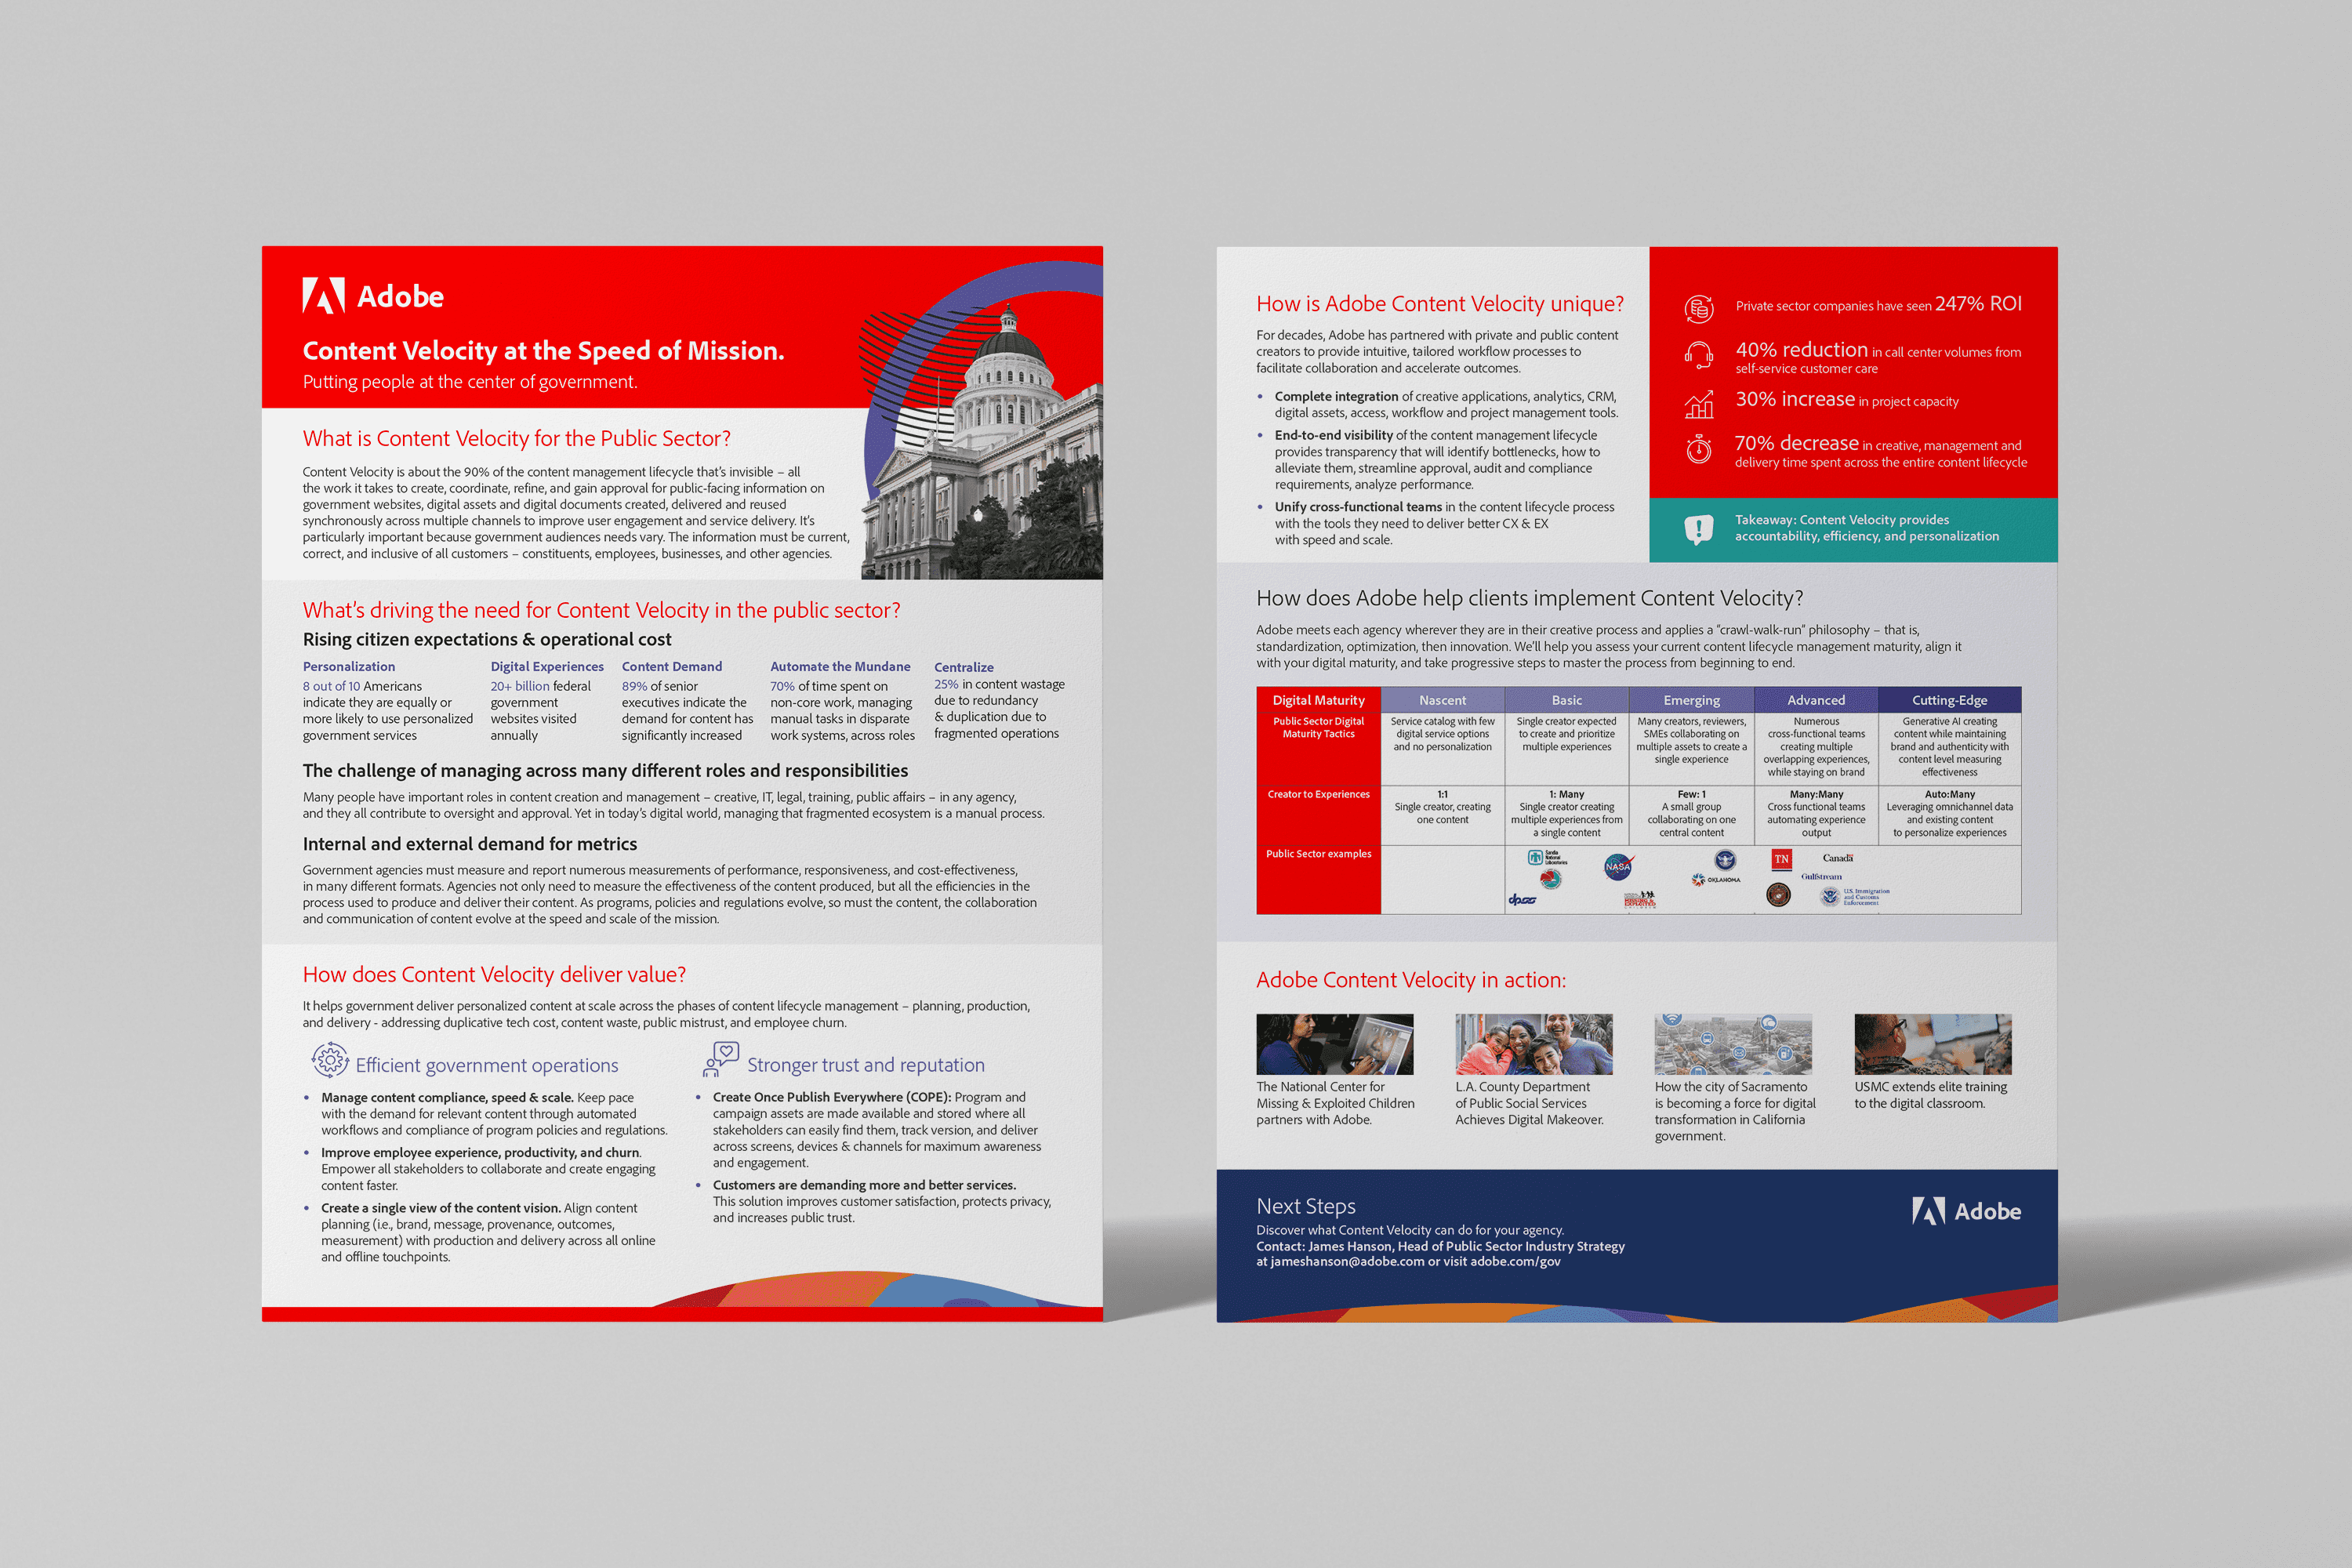
Fig. 05
A two-page overview.
Fig. 05
A two-page overview.
03
What happened
What happened
Presentation, two-page overviews and blog content for the States edition and the Cities and Counties edition
Used in Adobe briefings with state and local government leaders nationwide
Presentation, two-page overviews and blog content for the States edition and the Cities and Counties edition
Used in Adobe briefings with state and local government leaders nationwide
Recognition
2024
Platinum, MarCom Awards
Adobe Digital Government Index
04
What I did
What I did
I led creative direction at Sage on both editions, first for states and then for cities and counties, keeping one design language across the two.
I led creative direction at Sage on both editions, first for states and then for cities and counties, keeping one design language across the two.
