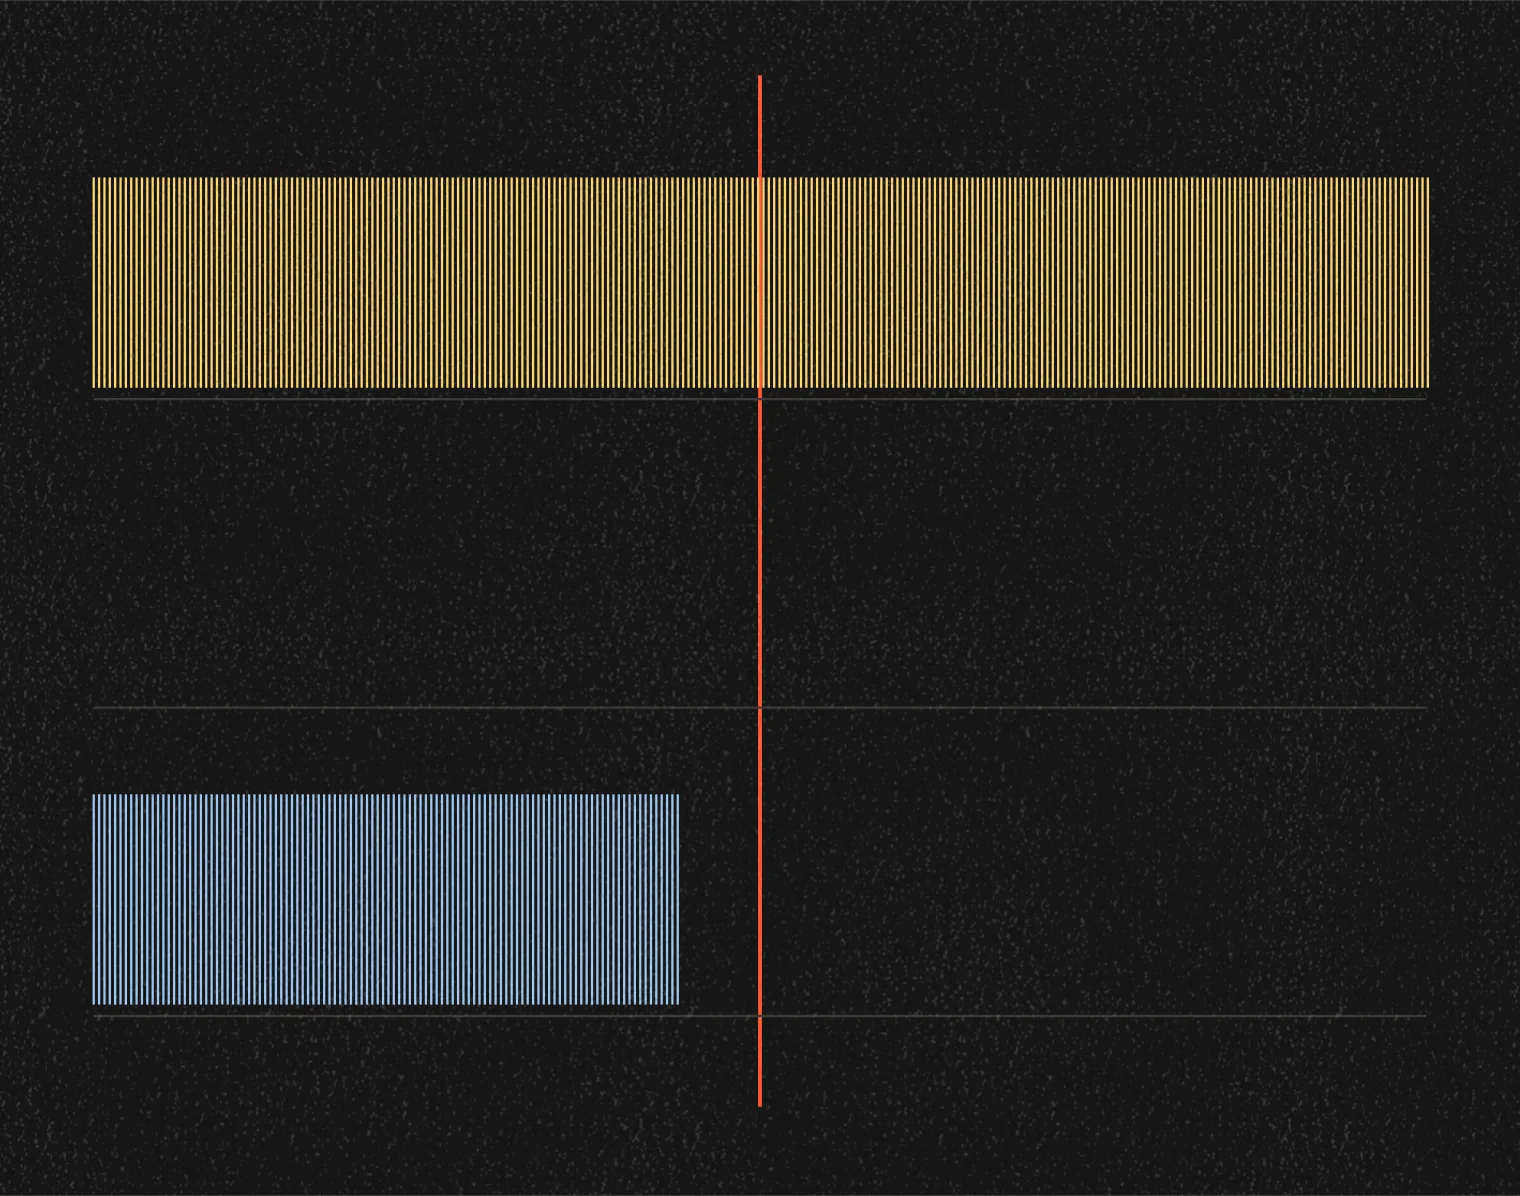
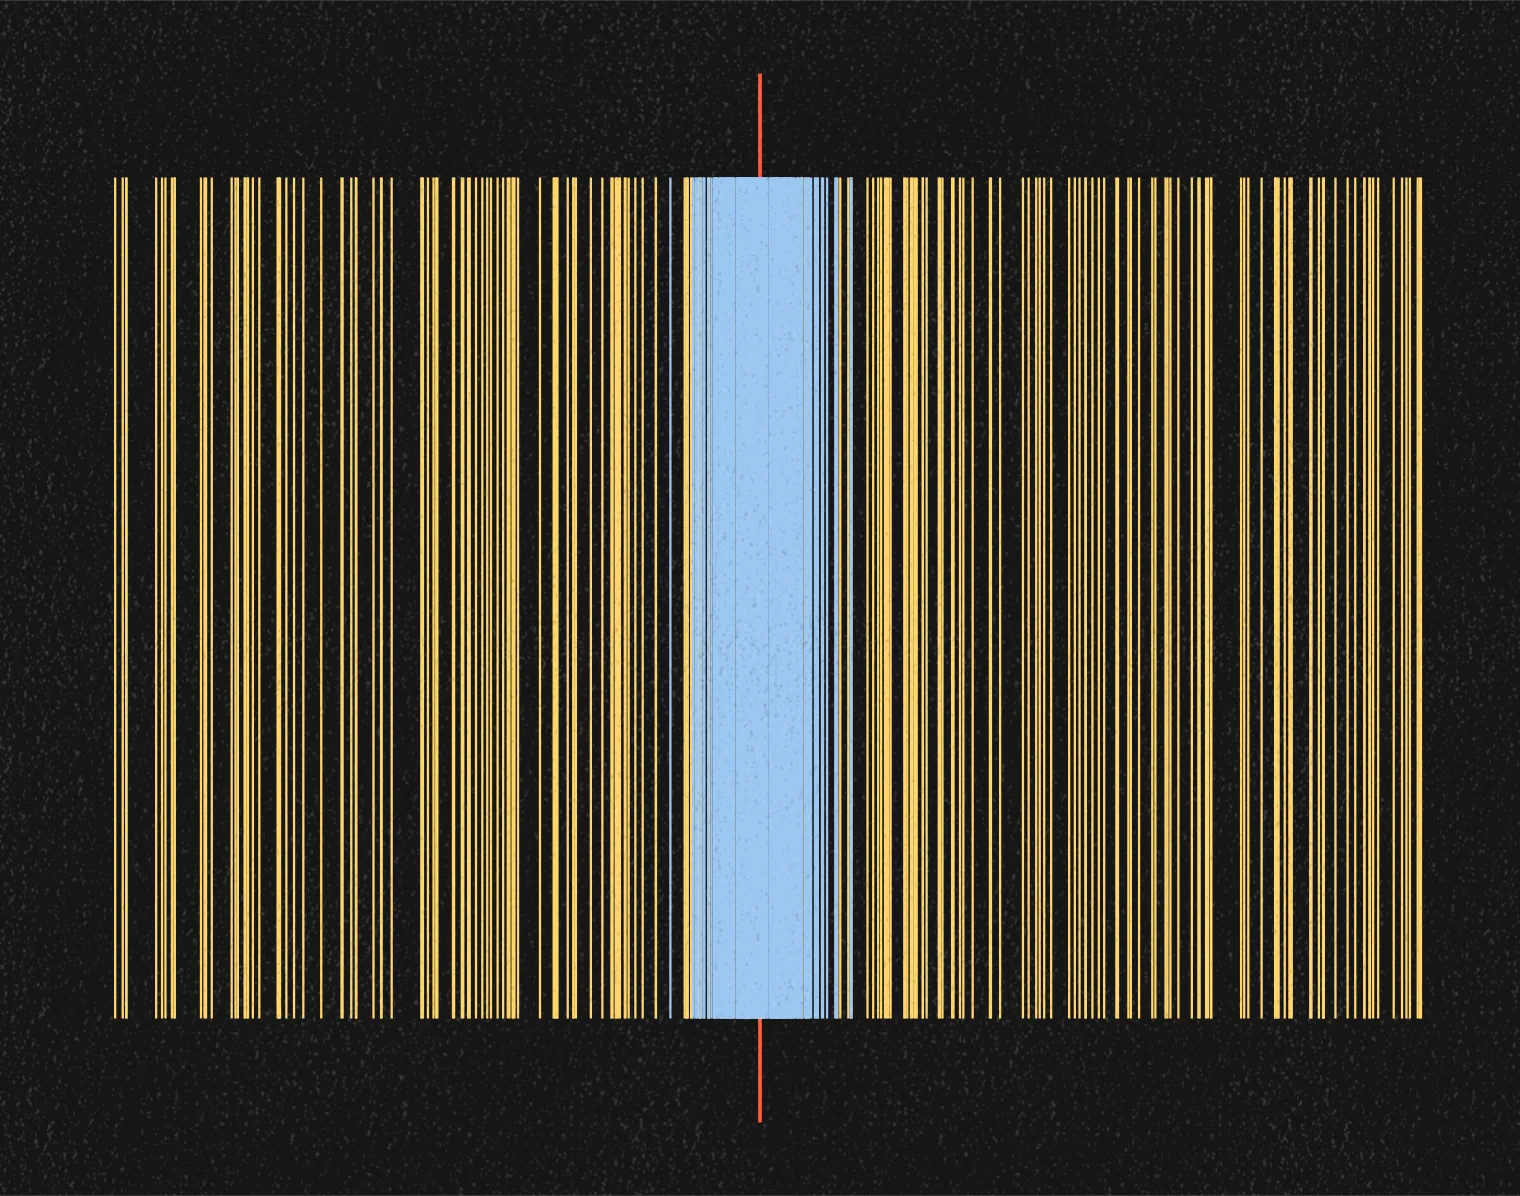
Essay
You already know what's coming
Ya sabes lo que viene
Ten industries, 246 ads, 124 brands. Two decisions decide the frame, and 108 of the 246 made them the same way.

· 17 min read

I pulled 246 image ads running in the United States, from ten industries and 124 brands, and for each one I wrote down two things: where the picture sits and where the words sit. That is all. Two decisions that coarse can only tell fourteen structures apart, so the count is not that there are few. It is that 108 of the 246 land in two of them: a picture, filling the frame or framed inside it, with the words across the top in the middle. In B2B SaaS, seventeen of the twenty-six ads are the same one, and they come from eleven different companies. In fast food, fifteen of twenty-four, from nine chains. Nobody copied anybody, which is the part I did not expect. What it costs I cannot prove, and it goes in here as a thesis: an ad built this predictably says what it is before anyone has looked at anything inside it, so you never get as far as deciding whether to read it. Reading is the third step. There is a great deal of clever writing in these ads. On a phone almost none of it is ever reached.
Skip to the five questions worth askingJunté 246 anuncios gráficos que estaban al aire en Estados Unidos, de diez industrias y 124 marcas, y de cada uno anoté dos cosas: dónde va la imagen y dónde van las palabras. Nada más. Dos decisiones así de gruesas solo distinguen catorce estructuras, así que la cuenta no es que haya pocas. Es que 108 de los 246 caen en dos de ellas: una imagen, llenando el cuadro o enmarcada dentro de él, con las palabras cruzando arriba al centro. En SaaS B2B, diecisiete de los veintiséis anuncios son la misma, y son de once empresas distintas. En comida rápida, quince de veinticuatro, de nueve cadenas. Nadie copió a nadie, que es la parte que no me esperaba. Cuánto cuesta eso no lo puedo demostrar, y va aquí como tesis: un anuncio armado así de previsible dice lo que es antes de que nadie haya mirado nada de lo que lleva dentro, así que nunca llegas a decidir si lo lees. Leer es el tercer escalón. Hay muchísimo ingenio escrito en estos anuncios. En un celular casi nunca se llega a él.
Salta a las cinco preguntasThe thing that started this was not an idea. It was a nuisance.
I kept scrolling past ads that felt like reruns. The problem was not what they were selling, and it was not the writing. It was smaller than either, and more irritating. Before the next one finished loading I already knew how it would be put together. A photograph filling the frame. The words across the top, in the middle. I was right often enough that I stopped reading them, and after a while I stopped deciding whether to read them.
So I counted.
At the end of September 2026 I captured 246 image ads running in the United States, from the ad libraries the platforms publish themselves. Ten categories, 124 brands, never more than two ads per brand. Five on Instagram: fast food, banking, automotive, auto insurance, fashion. Five on LinkedIn: cybersecurity, B2B SaaS, business schools, financial media, HR software. I left video out, because it is a different craft and I did not want to average two things into one number.
Two decisions, read by eye
I opened each of the 246 at full size and marked two rectangles on it: where the picture is, and where the words are. Whether the picture fills the frame or sits inside it. Whether the words are at the top, the middle or the bottom, and whether they are centered or pushed to one side, or whether there are no words inside the frame at all. Nothing about color, typeface, faces, logo size, or what the ad says. Two decisions, the ones made before anyone picks a photograph or writes a line, and I counted two ads as the same structure when those two decisions matched, not when every detail did.
Two decisions with that few values can only produce fourteen structures, and the 246 ads use thirteen of them. That is not the finding; an instrument this coarse would find repetition in a pile of random rectangles. The finding is where the ads pile up inside those fourteen boxes, and how far that is from what chance would do. Spread 246 ads across fourteen boxes at random and the fullest one would hold about twenty-five. The fullest one here holds sixty-eight. The two fullest would hold about forty-eight between them. Here they hold 108.
Look first

FIGURE 1 · Fast food.
12 brands · 24 ads · Meta Ad Library · United States · image ads only, video excluded.
Each brand gets two ads and two bands. The top band is the ad as I captured it. The bottom band is the structure: a grey rectangle where the picture is, a black one where the words are, drawn from the ad and nothing else. It cannot hold color, typeface, packaging or a face, so it is useless for almost everything, and nothing I left out can be read back out of it. What it holds is the only question I am asking: how often the next ad is put together the same way as the last one. Read the top band first, all twelve brands. Then read the bottom band and notice how little changes.
Twelve chains that compete with each other and share no constraint except selling food fast. Nineteen of the twenty-four ads let the photograph fill the frame. Fifteen of them, from nine different chains, put the words across the top, centered, over that photograph. Five of the twenty-four ads are built any other way at all.
Here is the count
Start with the grid you just read. Fifteen of fast food's twenty-four ads are one structure, from nine different brands; add the second most used, and nineteen of twenty-four.
Here are all ten, counted the same way. Each category has between eleven and thirteen brands and between twenty-one and twenty-six ads; the first column is how many of those ads share the single most used structure, the second is how many different brands those ads come from, and the third adds the second most used structure to the first.

The bottom of that table is the counter-case, and it is here rather than left out. The most used structure in auto insurance is five of its twenty-one ads, from four brands. Business schools and fashion sit just above it. Three of these ten categories spread out across their thirteen structures instead of piling into one, and they came out of the same counting as the seven that do pile up.
FIGURES 2–5 · The other four Instagram categories. Same two bands, same reading order as figure 1.

2 · Banking. 11 brands · 22 ads.
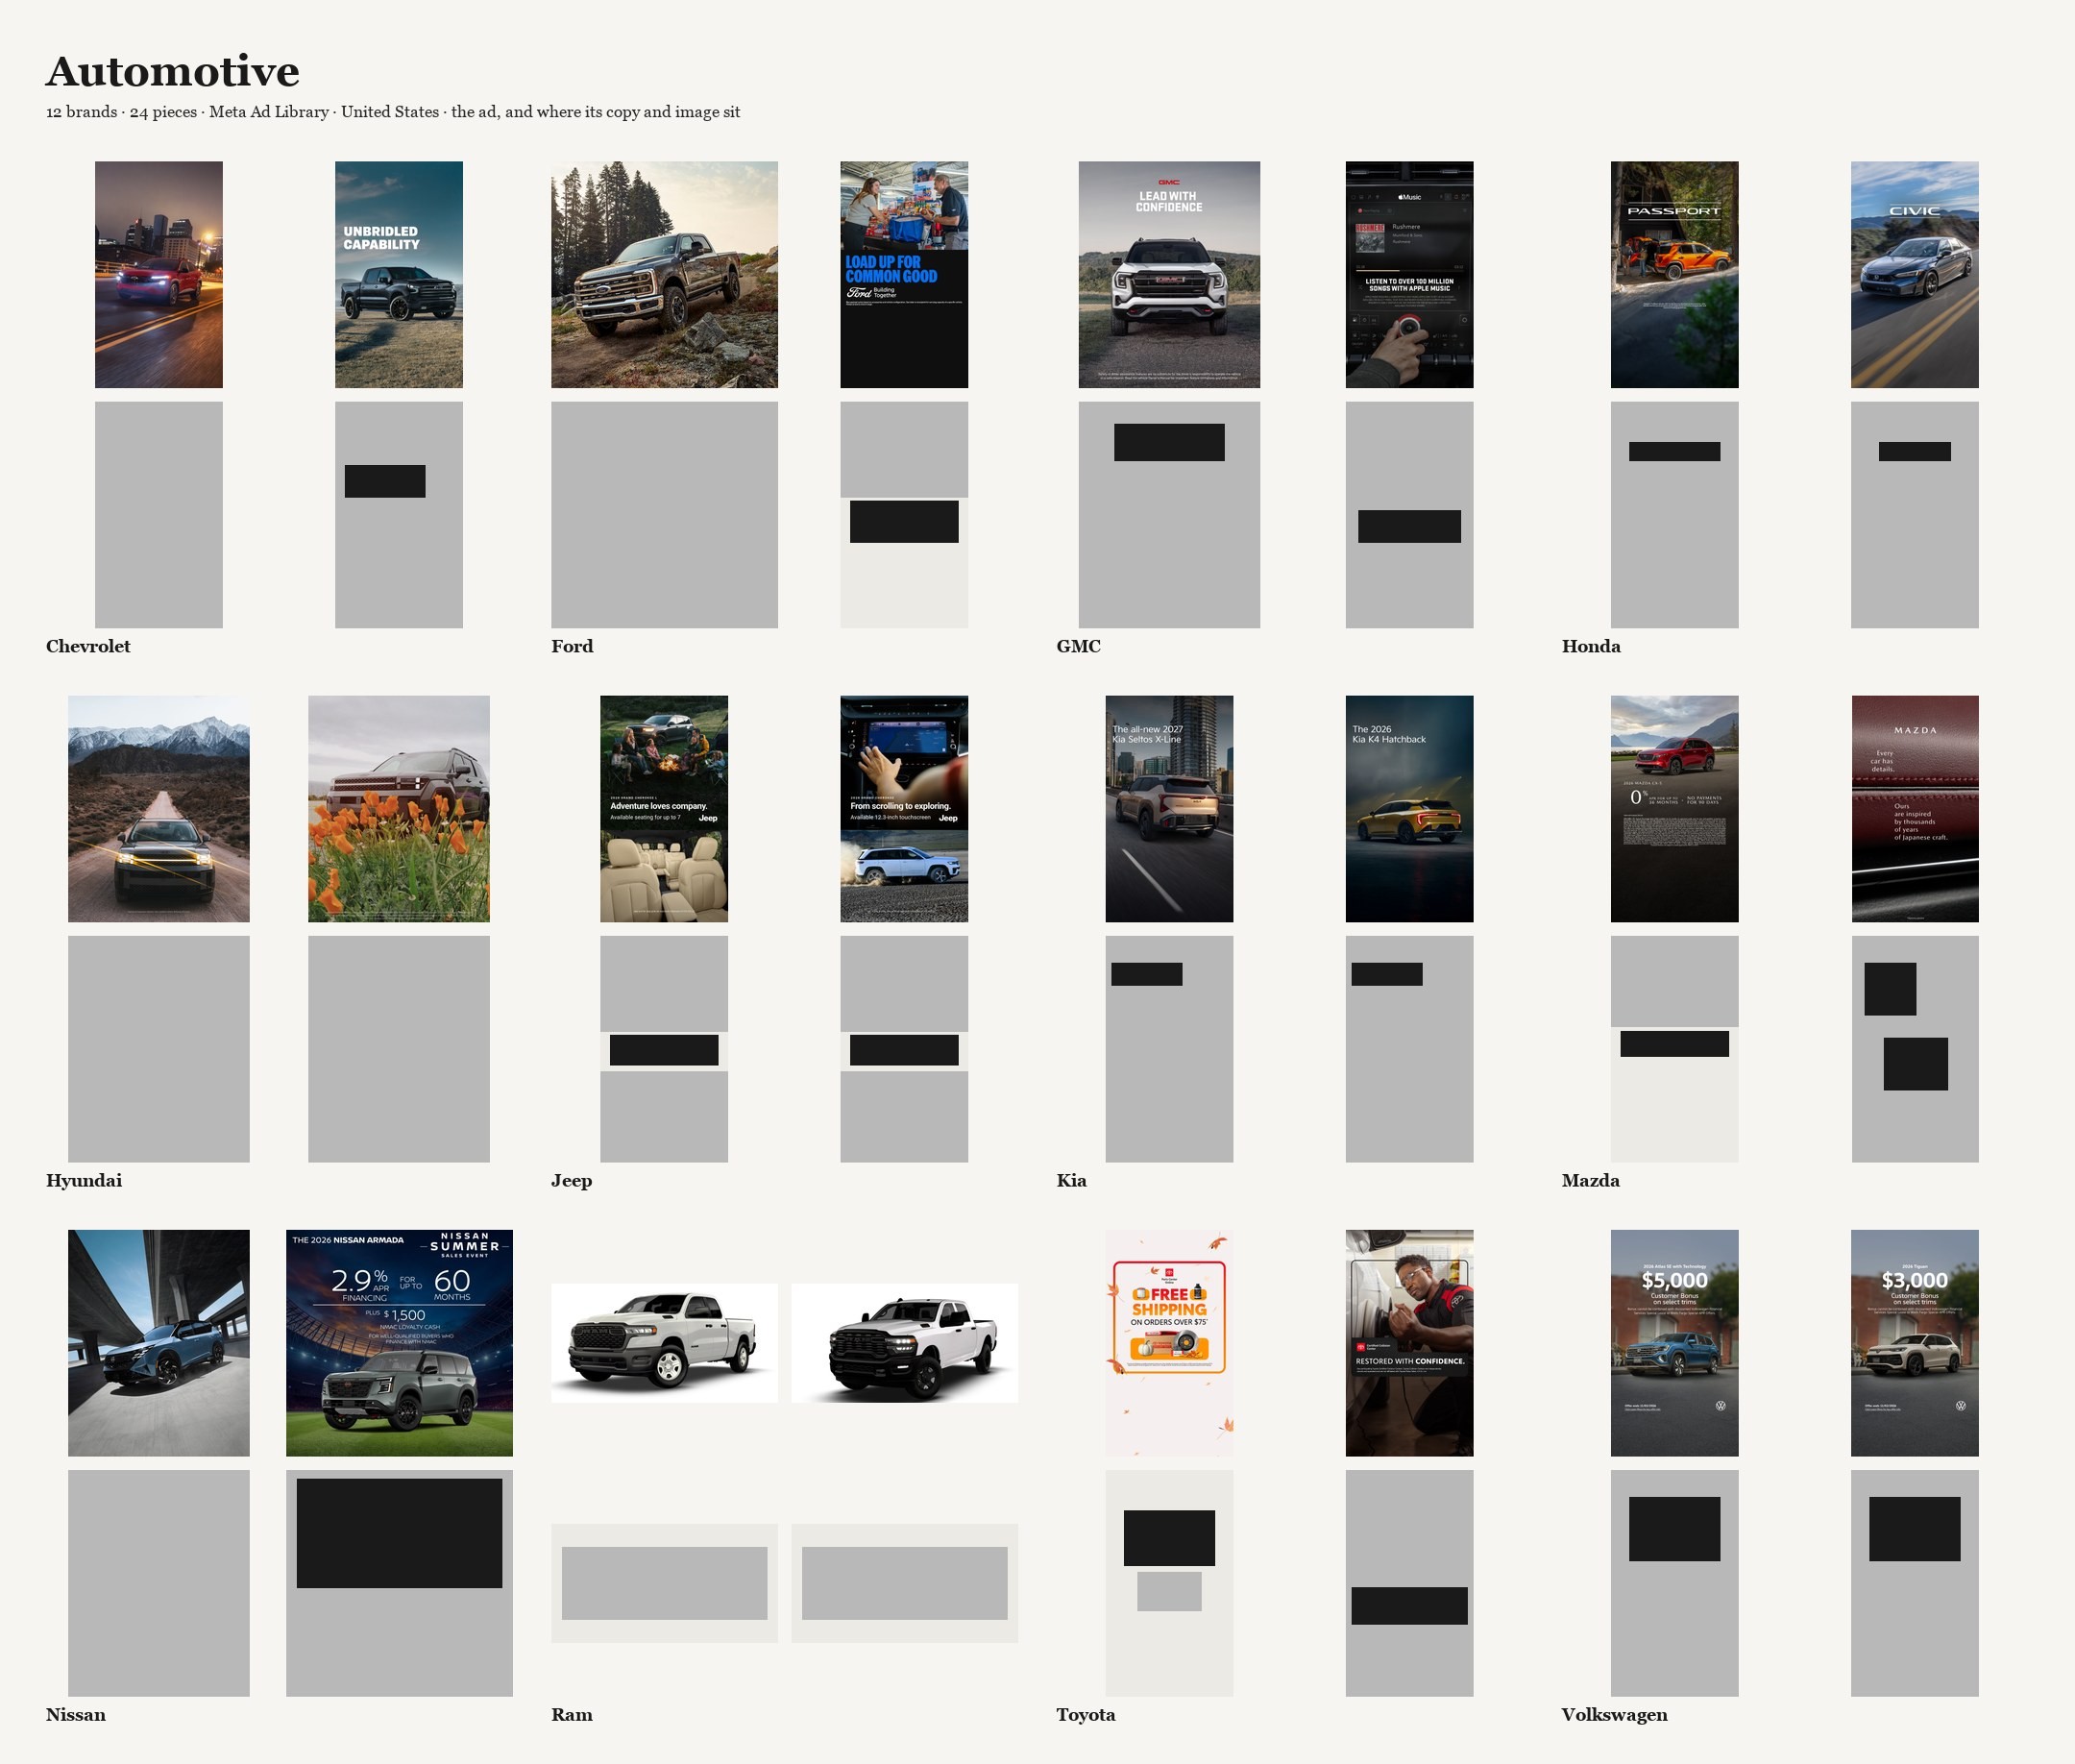
3 · Automotive. 12 brands · 24 ads.

4 · Auto insurance. 11 brands · 21 ads.
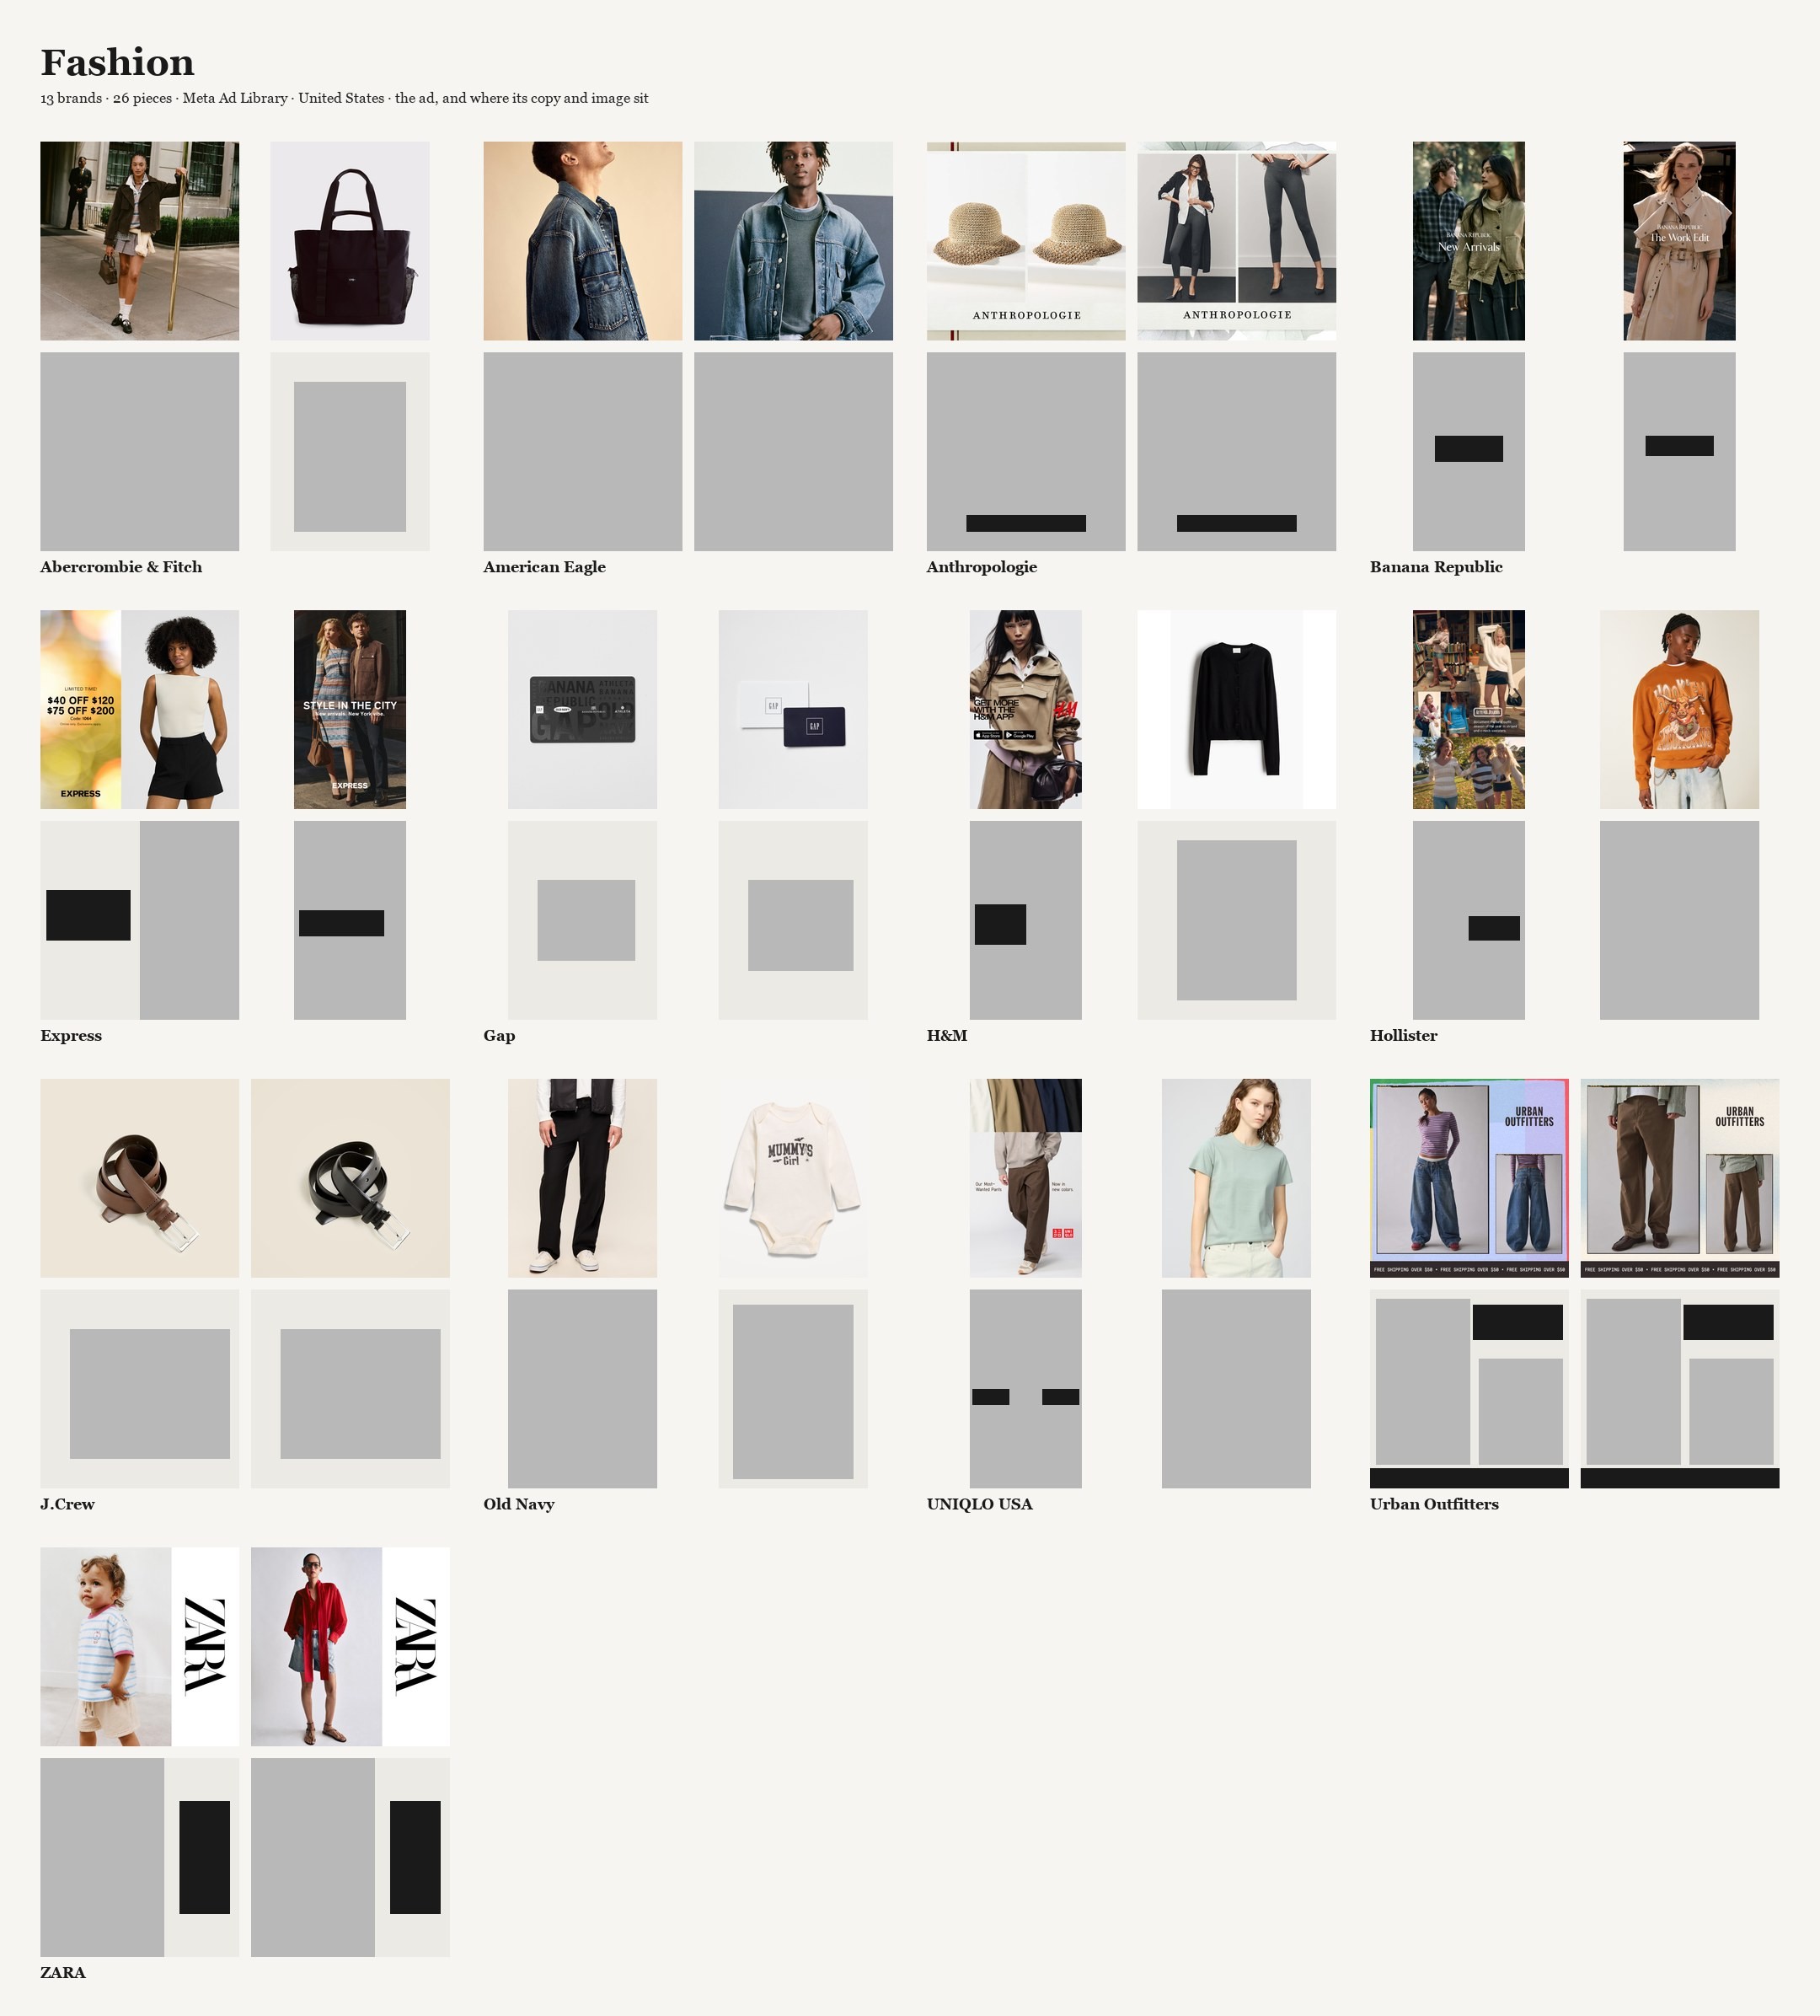
5 · Fashion. 13 brands · 26 ads.
Automotive, in figure 3, converges on something else. Nine of its twenty-four ads share the fast-food structure, photograph filling the frame and the words across the top, but the thing twelve car brands agree on is the photograph. Seventeen of the twenty-four let the picture bleed to all four edges. Seven of them carry no words inside the frame at all: a truck on a road, a name in the corner if that, and nothing else. Where fast food agrees about where the words go, automotive agrees that the picture is the ad.
Half of the 117 Instagram ads sit in three structures. At random, the fullest of fourteen boxes would hold about fourteen of 117; the fullest here holds thirty-one. And the fullest box is the same one in four of the five Instagram categories: words across the top, in the middle. Only fashion piles up somewhere else.
A client looking at the grid for their own sector explains it by the sector: this is how banks advertise. Four categories out of five piling into the same box say the sector is not what is deciding.
Fashion loosens, and here is why. Thirteen of its twenty-six ads carry no words inside the frame at all. I checked every one of them for small type hiding in a corner; what is written there is a wordmark and nothing else. The category that gets away gets away by saying nothing.
FIGURES 6–10 · LinkedIn. Same two bands again, five industries.

6 · Cybersecurity. 13 brands · 26 ads.

7 · B2B SaaS. 13 brands · 26 ads.
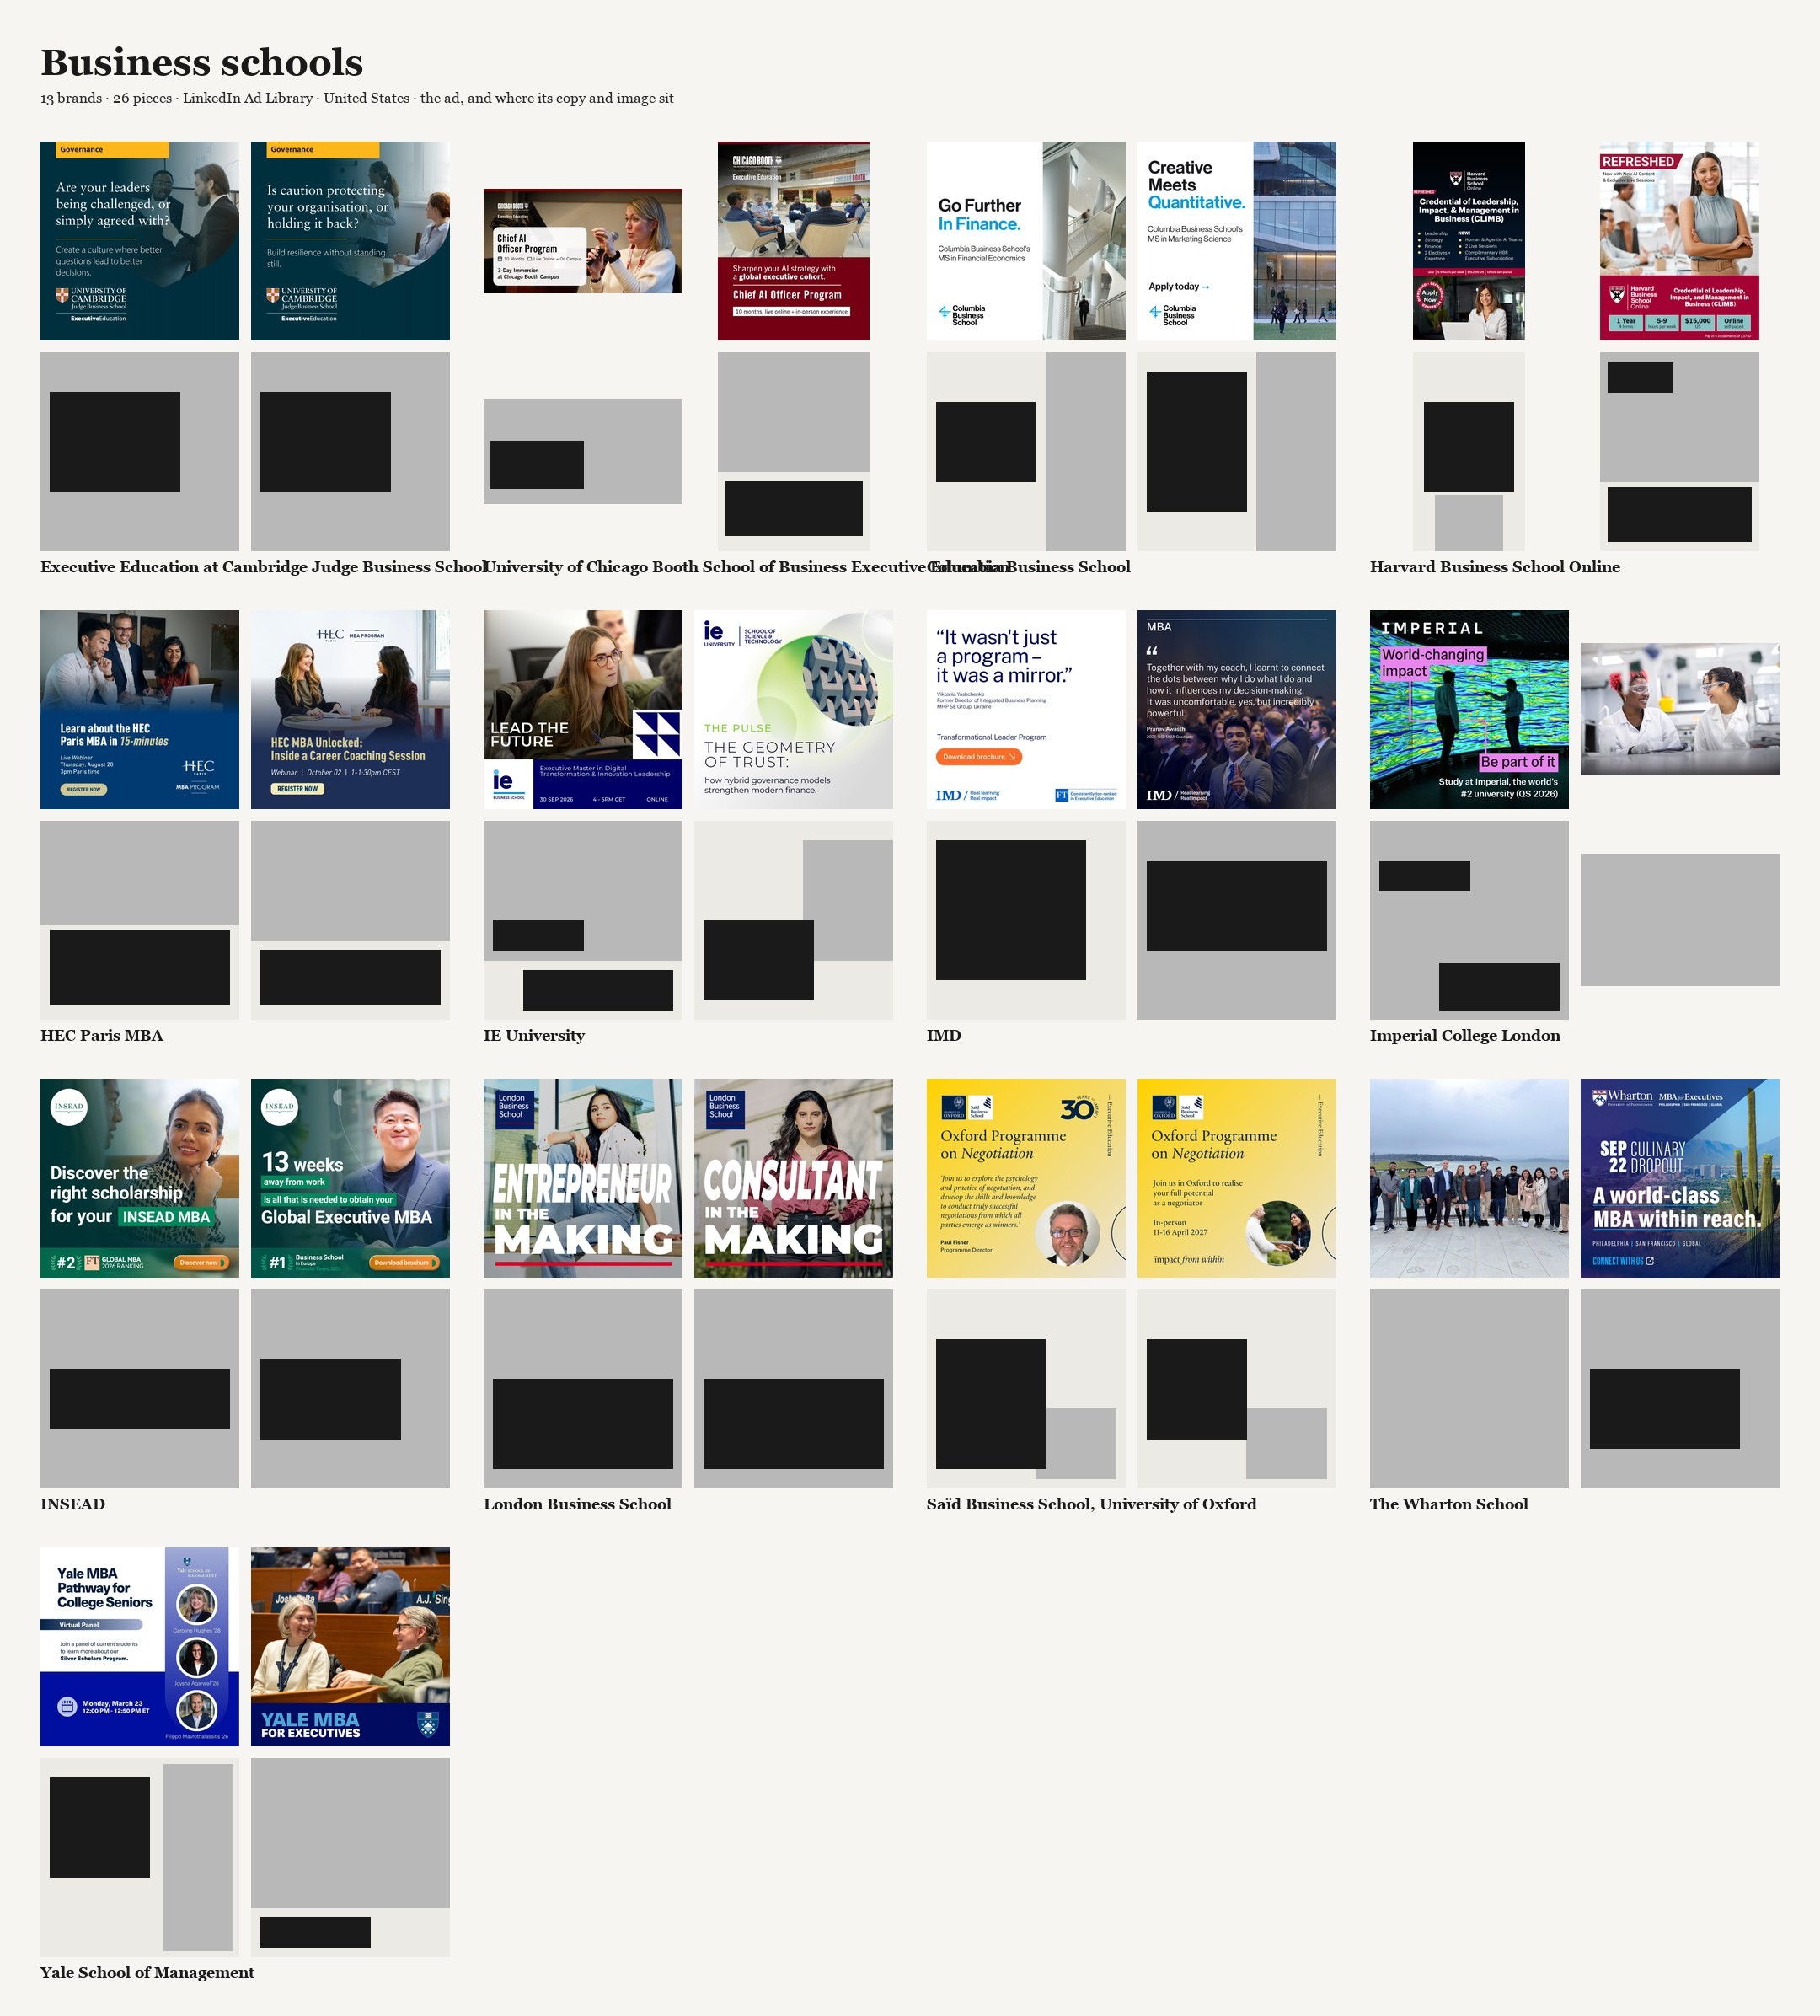
8 · Business schools. 13 brands · 26 ads.

9 · Financial media. 13 brands · 25 ads.

10 · HR software. 13 brands · 26 ads.
Same exercise on the other platform, on its own terms. One hundred twenty-nine ads, sixty-five brands, five industries, and half of the 129 sitting in two structures. At random the fullest box would hold about fifteen of 129; here it holds forty-seven, and it is the fullest box in four of the five LinkedIn categories as well. Look at the SaaS grid in particular: words across the top, centered, and a picture framed underneath them, a screenshot, an illustration, a photograph of people at a table. That one structure is seventeen of twenty-six ads and belongs to no one. Airtable, Asana, Atlassian, Databricks, Figma, HubSpot, Miro, Notion, Slack, Zoom and monday.com are all in it. Eleven companies that compete for the same budgets, and seventeen of their twenty-six ads built one way.
At random, twenty-six ads spread over fourteen boxes would put four or five in the fullest one. SaaS puts seventeen. That is the strongest row in the study, and it is on LinkedIn, not Instagram. The two platforms converge on the same place for the words and disagree about the picture. On Instagram the most used structure is a photograph filling the frame with the words across the top: thirty-one of 117 ads. On LinkedIn it is a picture framed inside the ad with the words across the top: forty-seven of 129. Same gesture, different container. Put the two together and 108 of the 246 ads, from every one of the ten industries, put their words at the top of the frame and in the middle.
Draw a structure once and the rivals line up inside it

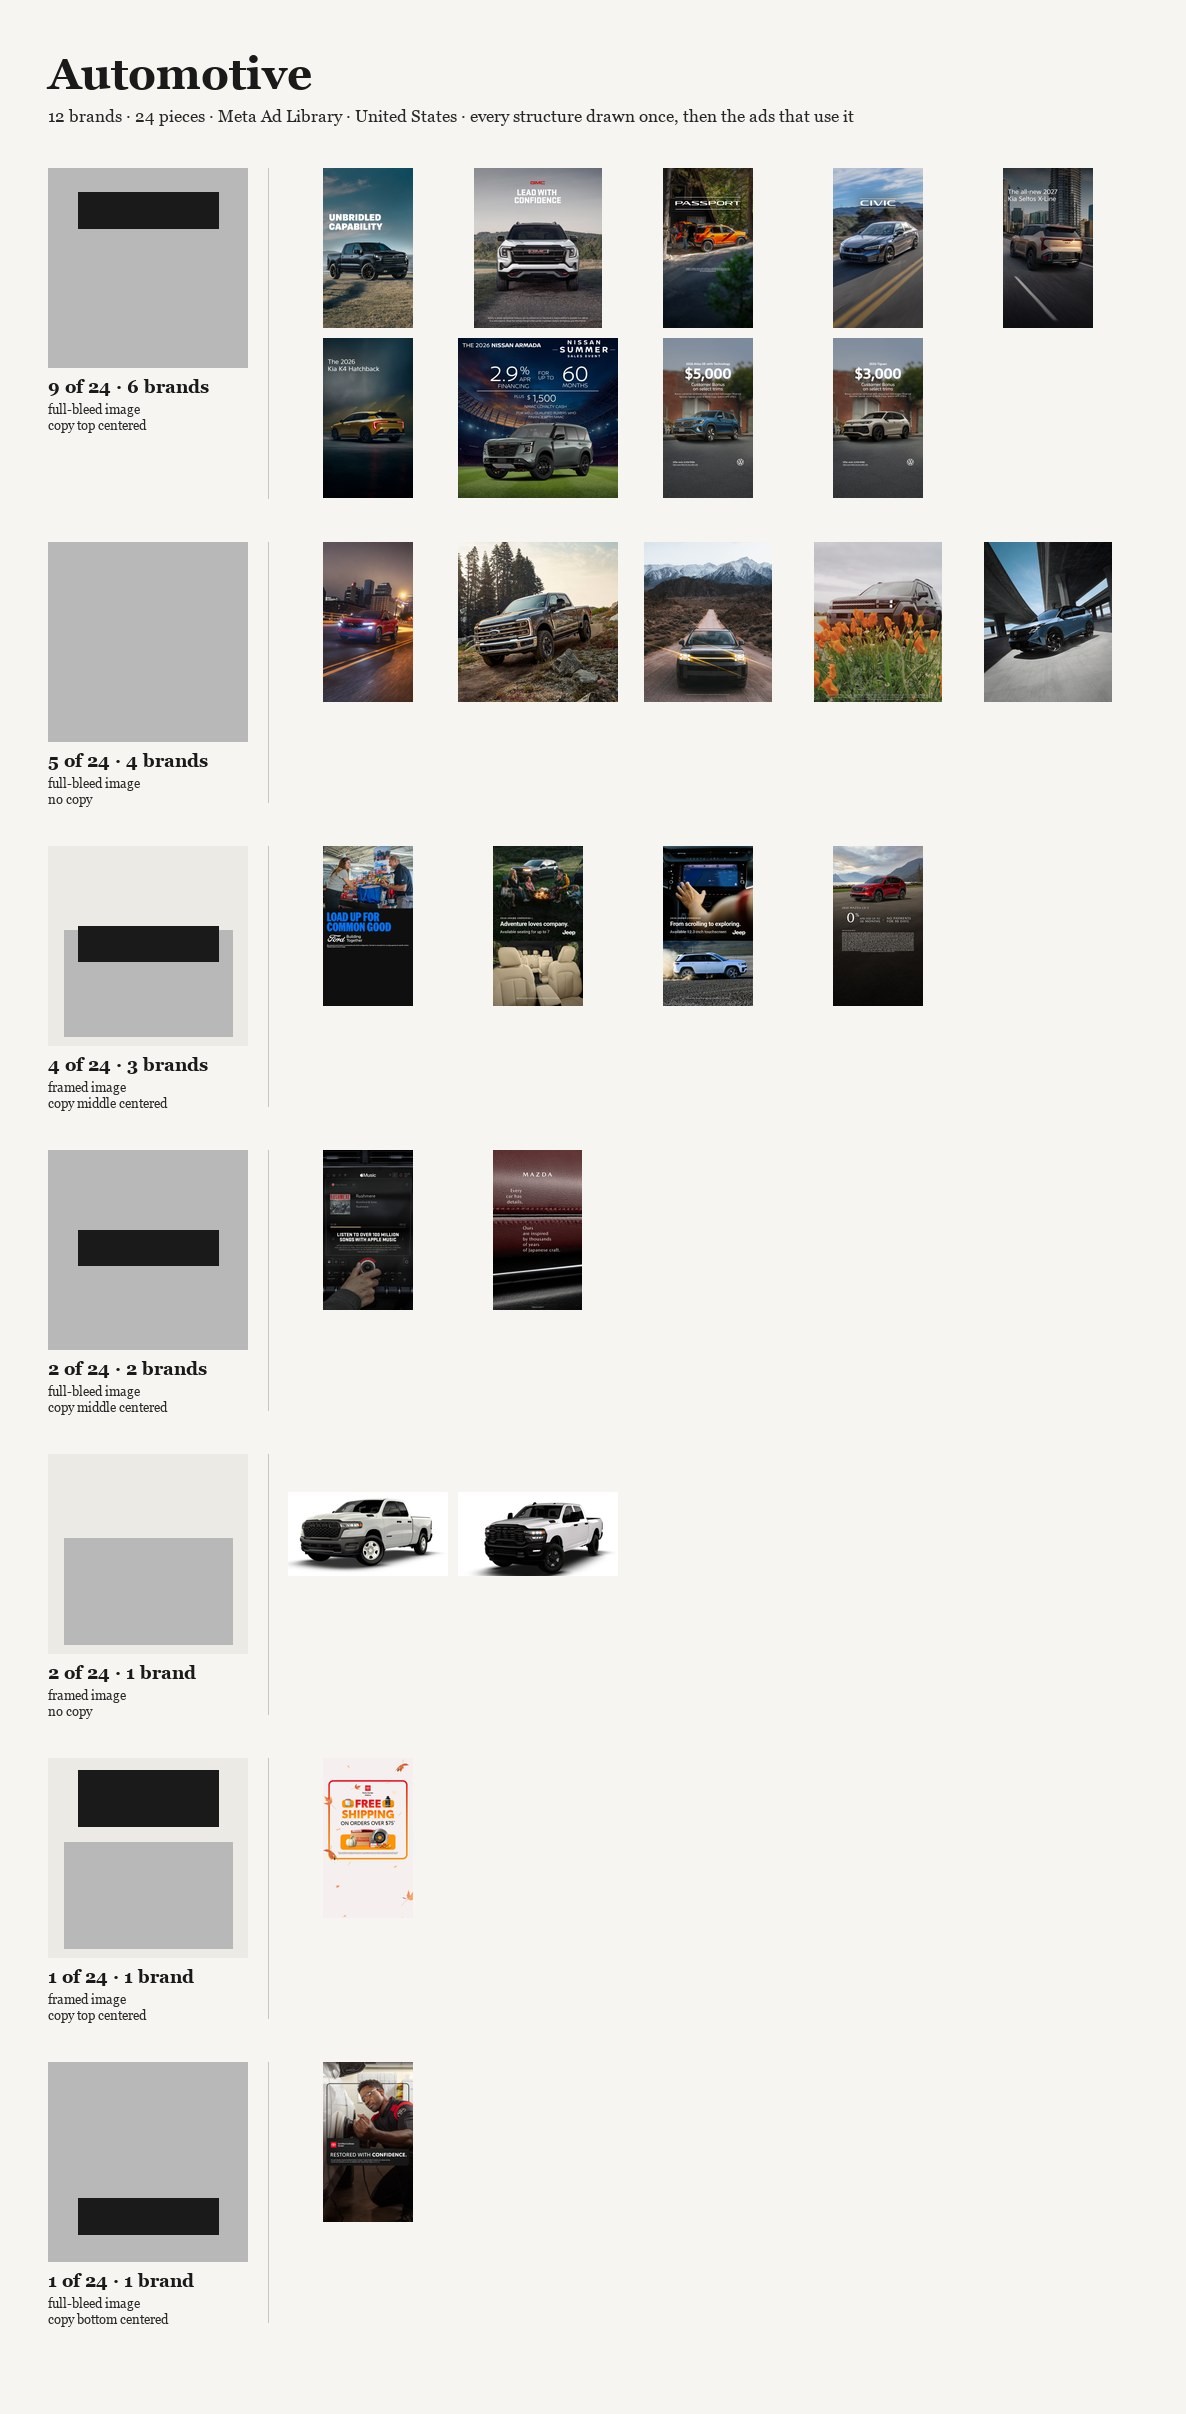


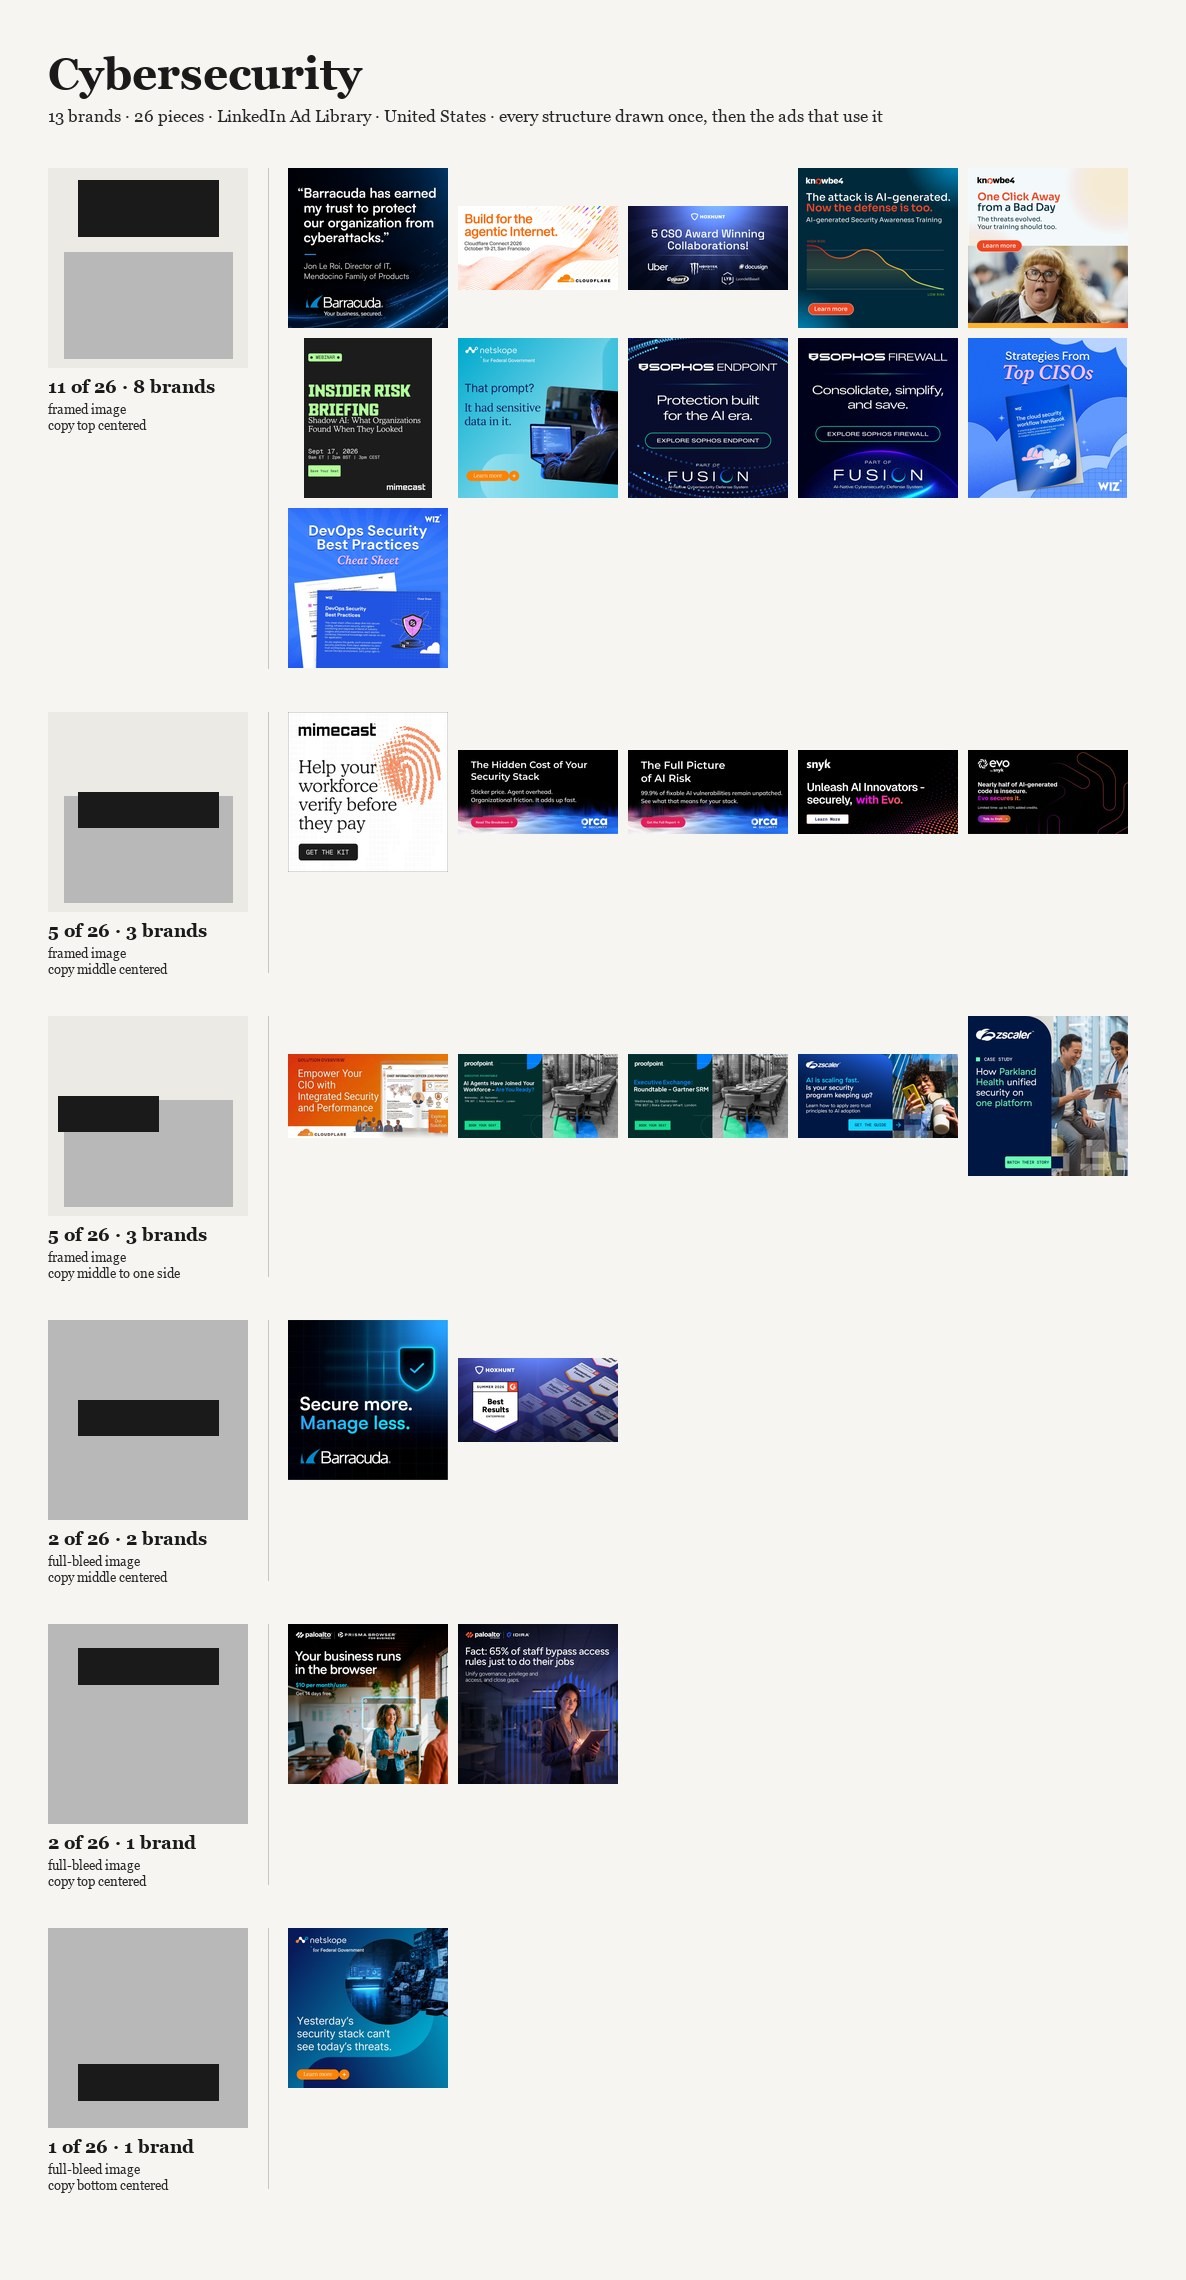
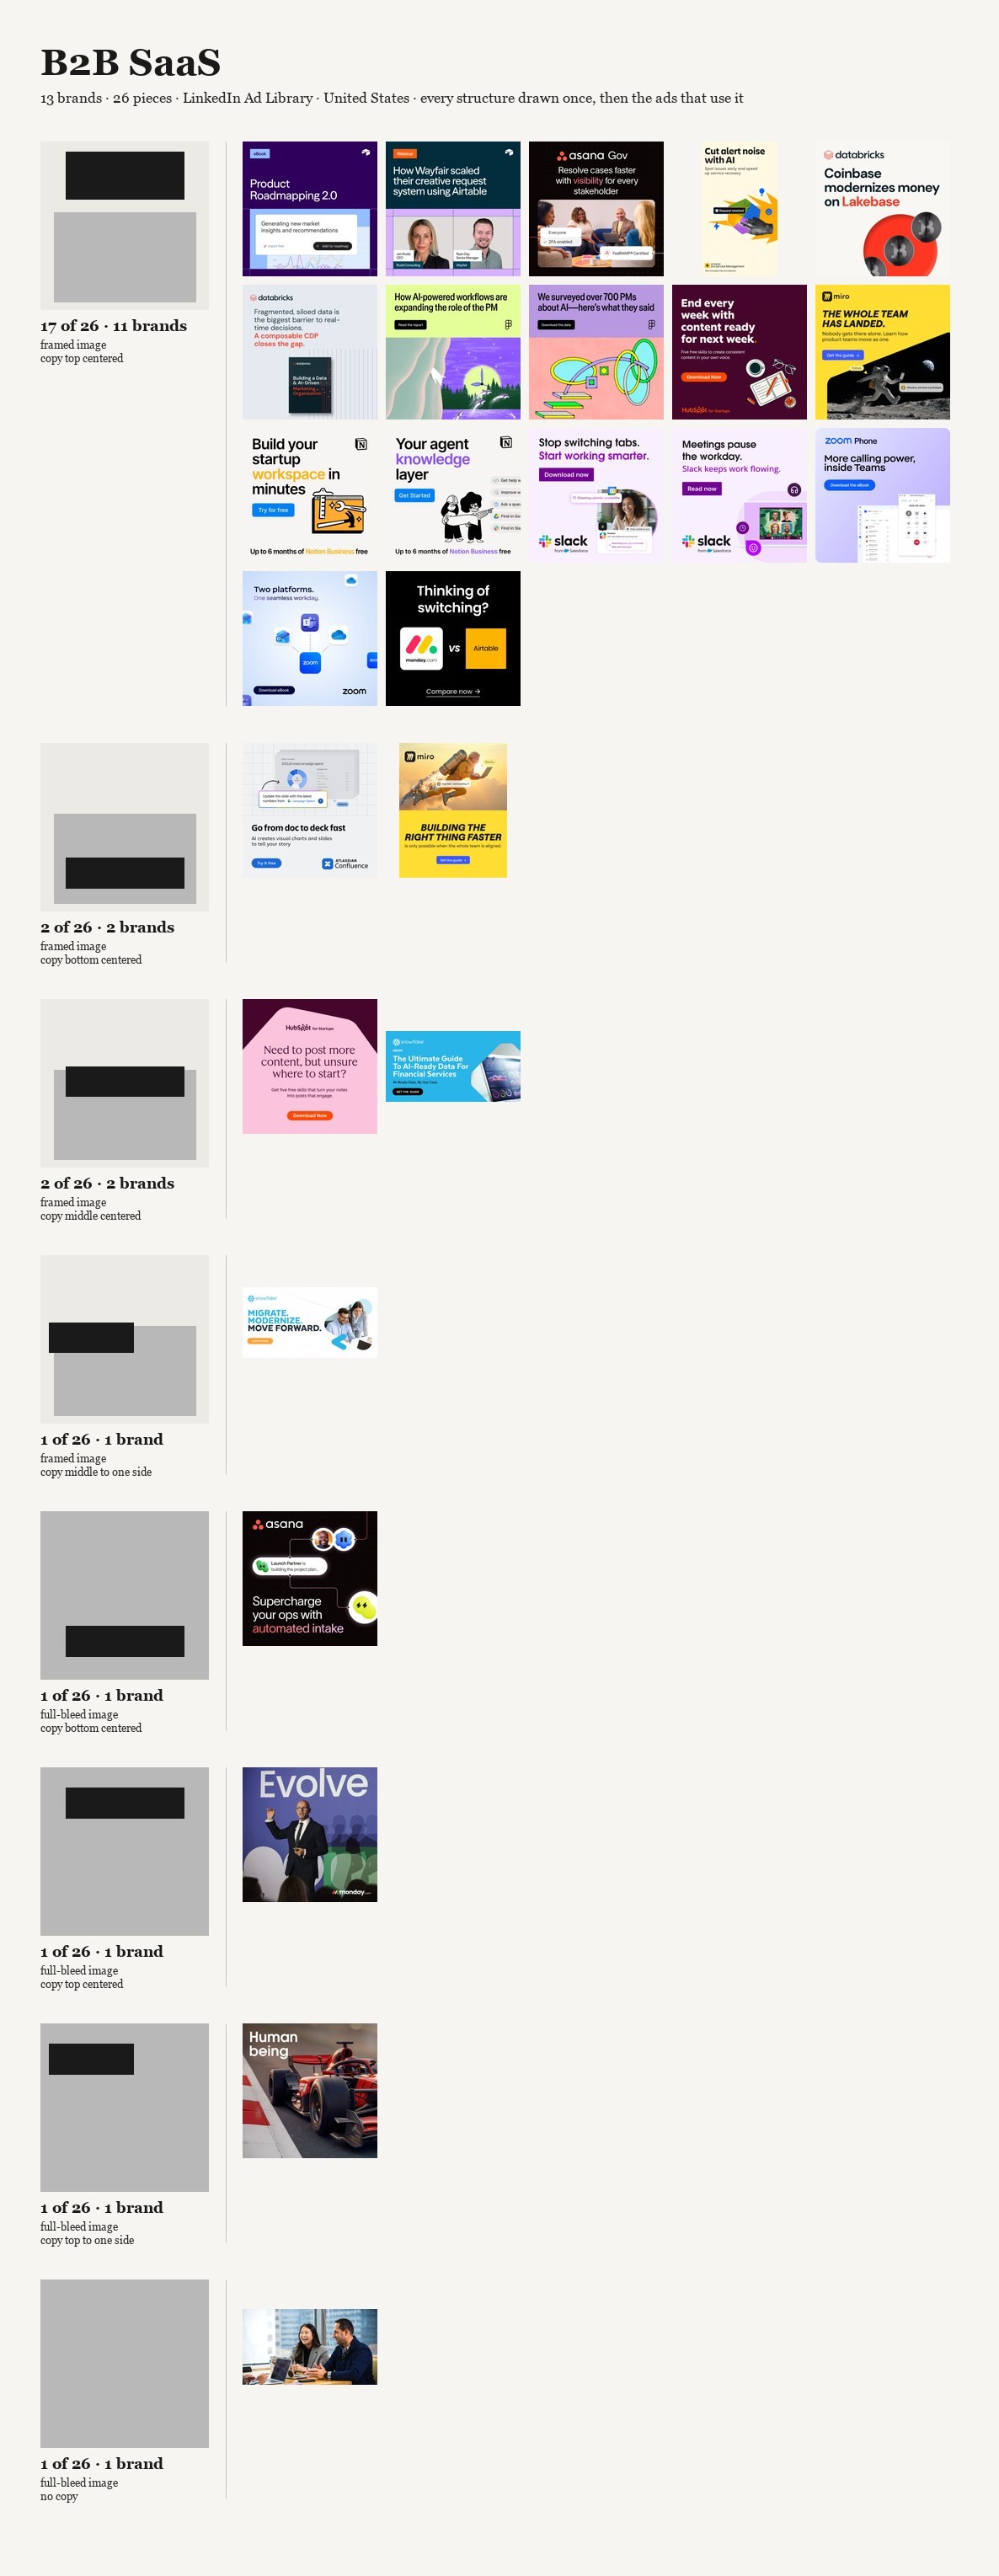


FIGURES 11–20 · The structure census, one per category.
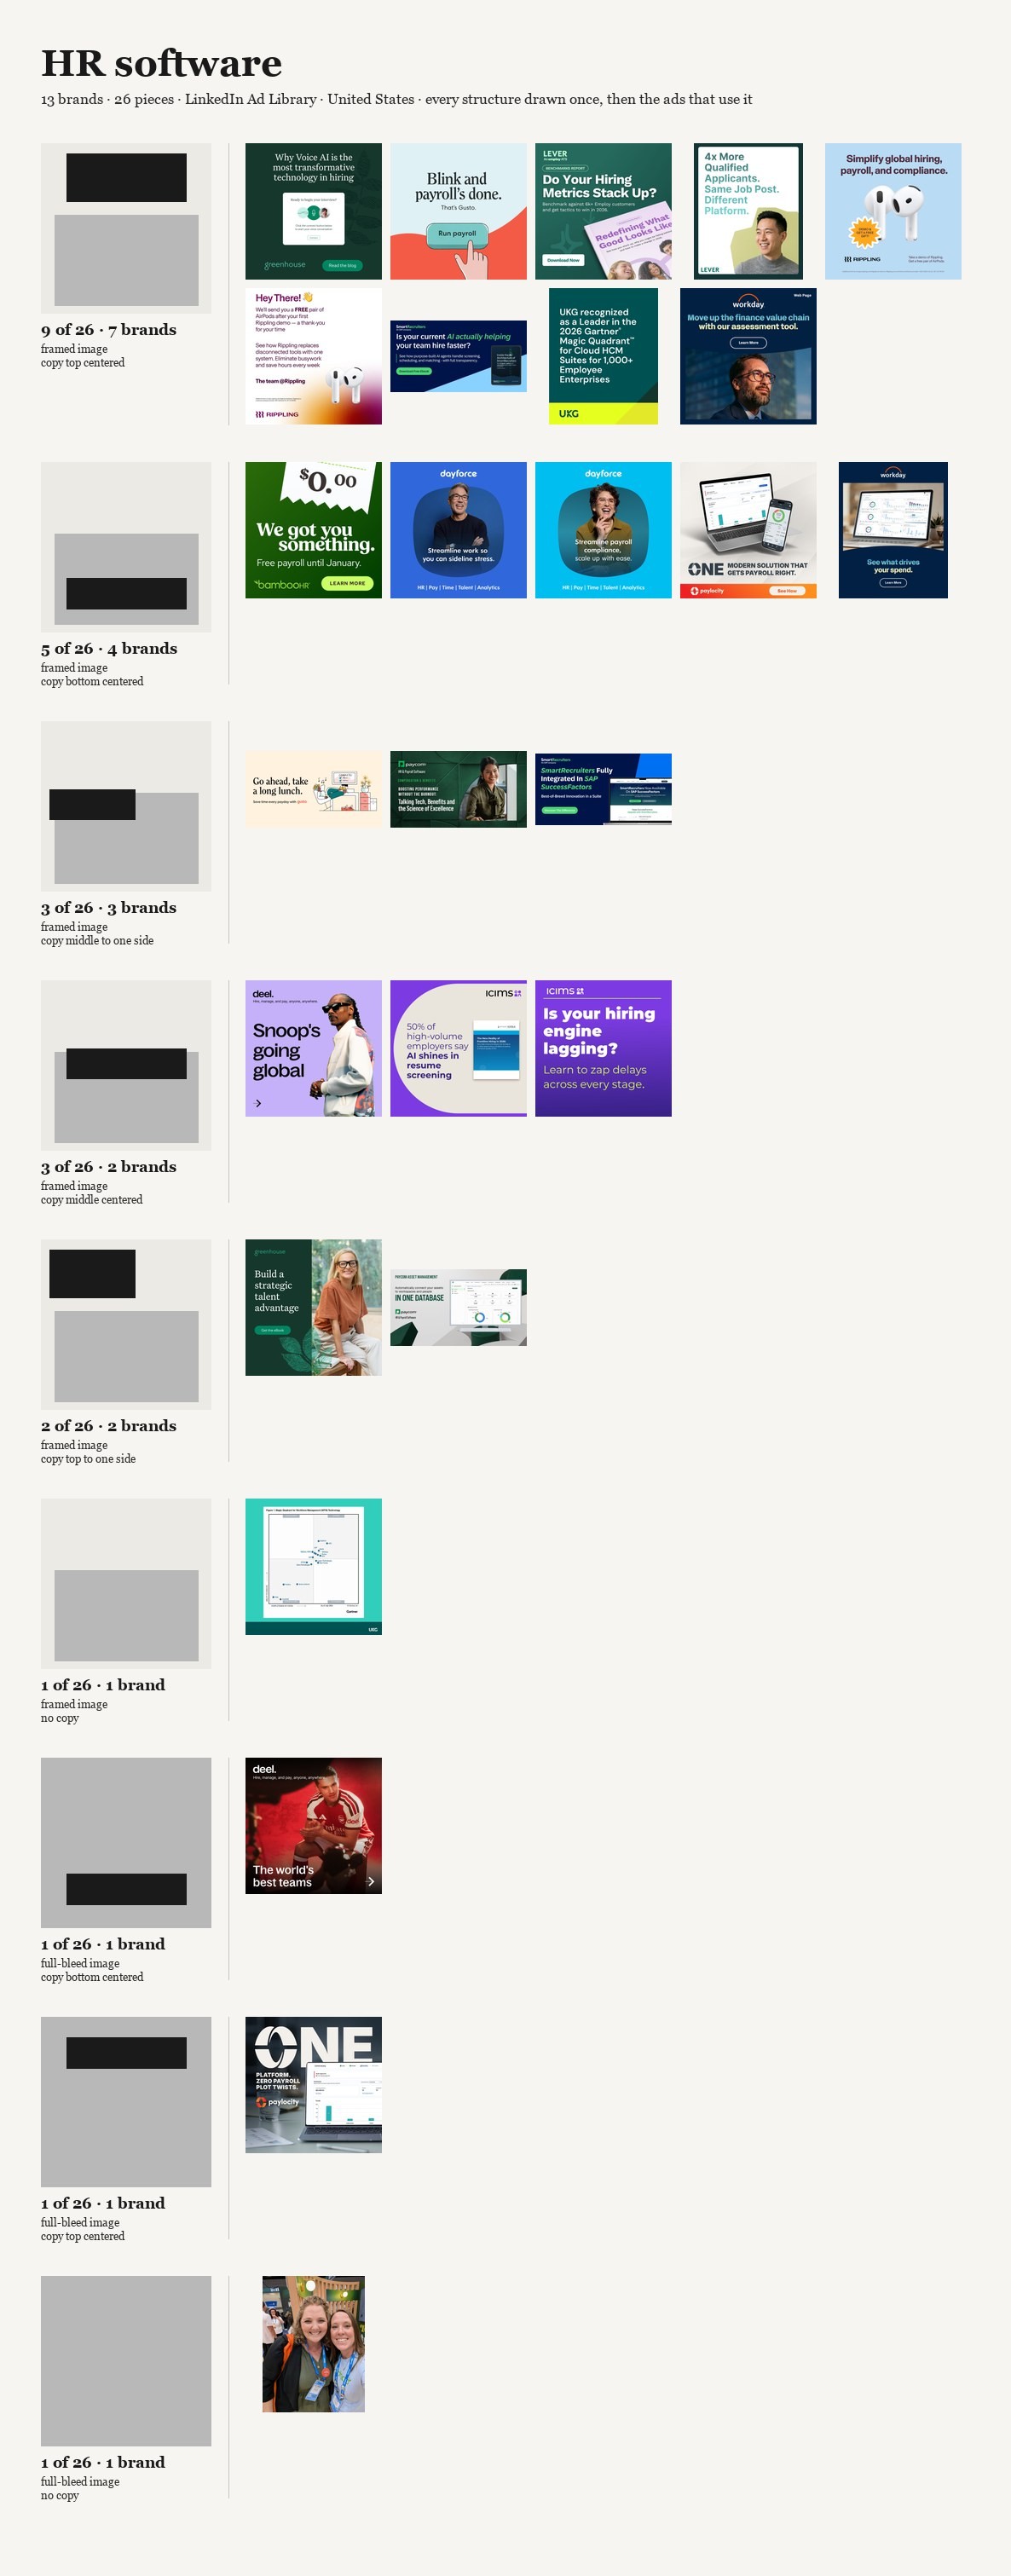
Every structure in the category drawn once, at the same size as the ads, followed by the real ads that fill it. Structures run most to least frequent, every ad in the study appears, and the order is fixed before drawing, so nothing here is a selection.
Read two of these next to each other: B2B SaaS and auto insurance. SaaS fills its longest row with seventeen ads from eleven different companies. Auto insurance has no row like that anywhere. Its longest is five ads from four brands, and it spreads twenty-one ads over seven structures. The figure does not show a mold there. It shows that there is not one.
That pair is the counter-case, and it is published as one. If the only censuses here were the seven that work, the fair accusation would be that I printed the categories that agreed with me.
One shortcut to avoid while you hold that thought: a short longest row is not the same as variety. Auto insurance is not inventive. Its twenty-one ads are spread across seven structures that every other category also uses; it simply has not settled on one of them. What a category does at its thin end is not the test. A long row of rival brands is.
The test throughout is the same one: not how many structures there are, which the instrument decides, but how far the piles are from even. Eight of the ten categories put their biggest pile in the same box, words across the top and in the middle, and in seven of those eight the pile is at least twice what chance would build.
I went looking for the copying
The obvious explanation is a structure traveling intact from brand to brand. It is not there. The two decisions do not travel together any more often than they land on the same answer separately.
That does not reduce the predictability. It explains it. These ads do not share a frame because a structure is being passed around. They share it because each decision, taken on its own, lands on the same majority answer: the picture where the container puts it, and the words at the top, in the middle. Two majority answers in a row produce a frame that has been built thousands of times. Each brand arrived at it on its own. Every one of those choices was defensible in the room where it was made, which is exactly why this is hard to see from inside it.
Past this point I am guessing
Looking at something is not one event. Something has to catch the eye. Then you decide whether to engage. Then, if that decision goes the right way, you read. Reading is the third step, not the first. I take that order as a premise and do not prove it here.
What I think predictability does is act on the first step, and act against you. An ad built the same way as the one before it, and the one before that, says what it is before anyone has looked at any of it. The viewer does not need to read a word to file it as an ad, because the construction already did that. And something filed as an ad, by someone who did not ask to see one, may lose the second step before it is reached. You may never arrive at whether to read it. You have already moved.

FIGURE 22 · A feed strip at phone size.
Ten ads, ten brands, five categories, Instagram only, one after another at phone size. Seven and a bit screens of ads with nothing in between.
This is a simulation, and the word is exact. No interface, no posts in between, no motion, no thumb speed. In a real feed these ten would arrive minutes and dozens of posts apart, never one after another, and I chose the order. So it is not evidence of behavior. It shows scale, and that is all I am offering it as.
Eight of the 117 Instagram ads were too small in the archive to go in, and five of those eight are fashion, so fashion had fewer eligible here than the other four categories. The figure does not show that.
I cannot prove a word of that. There is no attention data in this archive: no memory test, no dwell time, no pass rate. There is not one reader in these 246 records. I counted how predictable the construction is. Whether predictable construction costs you the stop is my thesis, and it stays a thesis. Settling it would take something aimed at the moment before the stop, and I am not going to improvise that in order to finish an essay.
But notice where it puts the craft. There is a great deal of clever writing in these ads: real wordplay, real wit, lines somebody fought for in a meeting. All of it lives on the third step. If the first step does not happen, none of it is ever reached, and the cleverest headline in the category is functionally identical to the dullest one. That is the part of this I find hardest to shake, because the effort is real and it is being spent at the far end of a sequence that may stop at the start.
One thing about my own sample
Meta's library ranks what it shows you by how much was spent, not by date, and there is no anonymous way to ask it for the most recent ads. So the Instagram half of this is the ads these brands put the most money behind. That ordering pushes all five Instagram categories toward whatever the algorithm is amplifying, and it inflates the resemblance between brands more than within them. What survives is narrower: among the ads these brands spend the most on, the construction converges, and those are the ones people actually saw. So I cannot write that unrelated brands independently arrive at the same structure. That claims independence, and the spend ordering breaks it on half the study. The five LinkedIn sets come back by date and do not carry this, and the strongest row in the study is one of them.
These are also the ads visible in two libraries over a few days. I archived them so the figures can be redrawn, but nothing here is a trend line.
And then this becomes training data
A grammar this narrow is not only a description of what advertising looks like now. It is a description of what the tools are being trained on, and that is where I think this gets worse rather than better.
First, a line I am not going to cross. I cannot tell you that generative tools caused any of this. There is no pre-2022 baseline in either ad library, no way to ask what the same ten industries looked like in 2019. For all this archive knows, SaaS was down to the same handful of structures a decade ago and nothing has moved. Anyone who shows you a number like mine as proof that the sameness is the machines is selling you a story my data does not contain. I cannot even tell you how much of what I captured was generated: one ad of the 246 is visibly machine-made, and that is a count of visible failures, not a rate of use. AI is in this piece as a question pointing forward.
A model reproduces the distribution it was shown. Train it on this, ask it for an ad, and expect the frame that dominates it. That is not a defect; it is the model working. The failure mode people worry about is the model doing something strange. The one I would bet on is the model doing something extremely normal, confidently, at volume, on request.
And there is a result that makes the forward direction look worse than a simple copy. Alemohammad and colleagues, at ICLR 2024, trained generative models on their own output across generations and separated two cases. Left alone, quality and variety both degrade and the samples become illegible. But bias the sampling toward the most typical outputs, the dial the authors use as a stand-in for the cherry-picking every real pipeline does, and the quality holds while the variety collapses faster. The result keeps looking good the whole way down. Their models are faces and handwritten digits, with no text-to-image model and no advertising in sight, so I am borrowing a shape and not a measurement.
But the shape is the thing. A pipeline that selects for "this looks like a good ad" is selecting on the third step. It is picking whatever is best finished. Nothing in that loop is selecting for the first step, because the first step is precisely what a human reviewing options at a desk, with full attention, cannot feel. So what gets spent is the thing that was already in short supply.
The reassuring counter-story needs the same care. People say model collapse is avoidable if data accumulates rather than replaces, and for language that is what the evidence shows. For images, the same paper that established it says the opposite in plain words: accumulating the data made the error grow round after round, with variety going down and the model dropping the rare cases first (Gerstgrasser et al., COLM 2024). The follow-up usually cited as confirmation contains no image model at all.
The two cases anyone has documented of a form leaking out of a training pipeline are not mine: both were a script applying one transformation to every image in the training set (Corvi et al., 2023; SDXL, 2024). Mine is a regularity of the content, put there by art directors one ad at a time, and I could not find a single documented case of that kind. Nobody has measured it. That is worse for the easy version of my argument and better for the question.
And people do this with no machine involved. The one controlled study I found on designers shown examples before sketching had a third condition nobody quotes: the group shown Google Images results got as stuck as the AI group, and came up with fewer ideas and more alike ones (Wadinambiarachchi et al., CHI 2024). The authors are careful where their own summary is not: they call the originality effects negligible and decline to claim significance. Being shown examples narrows what you make. That is not a fact about generative models. It is a fact about examples, and this archive is a very large pile of examples whether a machine reads it or a person does.
The best answer to all of this, and I cannot beat it
Road signs look alike on purpose. A stop sign expressing its municipality's visual identity would be a worse stop sign.
A predictable structure may be an asset. If the eye already knows how to read this frame in this container, none of the viewer's effort goes into locating the words and all of it goes into what the words say. Predictable and legible are the same property described by someone who likes it and someone who does not. On that reading, the convention is buying comprehension, and a brand that breaks it pays for it in comprehension.
The only thing I would say back is that the whole defense is an argument about the third step. It describes what happens once someone is reading. It has nothing to say about whether they started, and that is the step I think the convention is spending. Deciding between that reading and mine needs a measure of effect, and there is none anywhere in these 246 records.
What I would actually do about it
I did not expect to end up here, and I want to be careful, because an essay that counts structures has not earned the right to tell anyone how to be creative.
What it has earned is a description of the loop. Ten industries that have nothing to do with each other, seven of them converging hard, and the tightest of those with seventeen of its twenty-six ads in a single structure: eleven software companies, operating independently and competing with each other, twenty-six ads between them. Nobody copied anybody. Every one of those decisions was the sensible one, defended with good reasons, approved by people doing their jobs well. That is what a loop looks like from the inside: not laziness, but a great many reasonable people arriving at the majority answer twice in a row.
And the loop has a new engine now, which is the part that moved me from noticing to writing. We are about to automate the majority answer, trained on a record of the majority answer and reviewed by people looking at the finish instead of the start. The variety goes first and the quality holds, so it will not feel like decline. It will feel like everything is fine.
So the case for risk is not that different is better. The legibility argument may well be right. The case is narrower and harder to argue with: the cost of the convention can be counted now, and the cost of departing from it cannot. One of those two numbers exists. If you are weighing them as though both are known, you are weighing a measured cost against an imagined one, and that is not caution. It is just the loop with a rationale attached.
And if the order is what I think it is, then the risk is in the wrong place. We are spending our nerve on the line, on the thing somebody will admire in the deck, all of it on the third step and all of it downstream of a stop that may not happen. The uncomfortable implication of my own counting is that the bravest thing in the file is not the cleverest headline. It is whichever one of these 246 was built outside the pile its category fell into. There are fewer of those than the table suggests, and I cannot tell you whether a single one of them worked.
Five questions before you approve the layout
Five questions worth putting in a brief, or asking in the room before anyone signs off on where the words and the picture go.
Where did the words land, and did anyone decide that, or did they just go to the top? Eight of the ten categories in this archive put their biggest pile in the same place, words across the top in the middle. If nobody in the room chose it, the container chose it for you.
Take the logo off. Whose ad is this now? Put the frame beside your two nearest competitors' with the brands covered. In SaaS, seventeen of twenty-six ads from eleven companies pass that test by failing it.
Which of the two decisions are we actually making? The picture's treatment is mostly fixed by the platform, full-bleed on Instagram and framed on LinkedIn. That leaves one decision that is still yours, and it is the one everybody makes the same way.
Is the cleverness in the line, and does the line sit on the third step? Everything written lives behind a stop this structure may never produce. Ask what the ad says before anyone has read a word of it.
What would it cost to be the one ad in the set built differently, and can anyone in the room put a number on it? The cost of the convention can be counted now. The cost of leaving it cannot. If both are being weighed as known, one of them is invented.
Sources
Five papers, all read in full, all peer-reviewed. None is about advertising, none is about layout, and none measures what I am asking here. They are in to mark where the evidence stops. Every number about the ads is mine.
Corvi, R., Cozzolino, D., Poggi, G., Nagano, K. & Verdoliva, L. (2023). "Intriguing properties of synthetic images: from generative adversarial networks to diffusion models." CVPR Workshops 2023, 7th Workshop on Media Forensics, pp. 973–982. arXiv:2304.06408. The JPEG Q=75 case and the ImageNet contrast, §4.
Podell, D., English, Z., Lacey, K., Blattmann, A., Dockhorn, T., Müller, J., Penna, J. & Rombach, R. (2024). "SDXL: Improving Latent Diffusion Models for High-Resolution Image Synthesis." ICLR 2024 (spotlight). arXiv:2307.01952. DOI 10.48550/arXiv.2307.01952. Crop conditioning and the "object-centered samples" quote, §2.2, p. 5; the 64-pixel bucket limit, §2.3, p. 7. The crop result is carried by Figs. 4 and 5, with no N and no effect size.
Alemohammad, S., et al. (2024). "Self-Consuming Generative Models Go MAD." ICLR 2024 (poster). arXiv:2307.01850. DOI 10.48550/arXiv.2307.01850. The sampling-bias result, §3.4, pp. 9–10, Figs. 6 and 7. Models: StyleGAN-2 on FFHQ at 128², DDPM on MNIST. No text-to-image model.
Gerstgrasser, M., Schaeffer, R., Dey, A., Rafailov, R., Korbak, T., Sleight, H., Agrawal, R., Hughes, J., Pai, D. B., Gromov, A., Roberts, D., Yang, D., Donoho, D. L. & Koyejo, S. (2024). "Is Model Collapse Inevitable? Breaking the Curse of Recursion by Accumulating Real and Synthetic Data." COLM 2024. arXiv:2404.01413. DOI 10.48550/arXiv.2404.01413. The image result, §2.3, p. 7. The image experiment is a VAE on CelebA.
Wadinambiarachchi, S., et al. (2024). "The Effects of Generative AI on Design Fixation and Divergent Thinking." CHI '24, article 380, pp. 1–18. DOI 10.1145/3613904.3642919. Three conditions and the Google Images control, tables 2 and 3. The study is Bayesian and declines significance claims.
Esto no empezó con una idea. Empezó con una molestia.
Venía pasando con el dedo anuncios que me parecían repeticiones. El problema no era lo que vendían, y no era cómo estaban escritos. Era algo más pequeño que las dos cosas, y más molesto. Antes de que el siguiente terminara de cargar yo ya sabía cómo iba a estar armado. Una foto llenando el cuadro. Las palabras arriba, al centro. Acertaba lo suficiente como para dejar de leerlos. Y al rato dejé de decidir si los leía.
Así que conté.
A finales de septiembre de 2026 capturé 246 anuncios gráficos que estaban al aire en Estados Unidos, de las bibliotecas de anuncios que publican las propias plataformas. Diez categorías, 124 marcas, nunca más de dos anuncios por marca. Cinco en Instagram: comida rápida, banca, automotriz, seguros de auto, moda. Cinco en LinkedIn: ciberseguridad, SaaS B2B, escuelas de negocios, medios financieros, software de RR. HH. Al video lo dejé fuera, porque es otro oficio y no quería promediar dos cosas en un solo número.
Dos decisiones, leídas a ojo
Abrí cada uno de los 246 a tamaño real y le marqué dos rectángulos: dónde está la imagen, y dónde están las palabras. Si la imagen llena el cuadro o va dentro de él. Si las palabras van arriba, al medio o abajo, y si van centradas o corridas a un lado, o si no hay palabras dentro del cuadro. Nada de color, tipografía, caras, tamaño del logo ni lo que dice el anuncio. Dos decisiones, las que se toman antes de que nadie elija una foto o escriba una línea, y conté dos anuncios como la misma estructura cuando esas dos decisiones coincidían, no cuando coincidía cada detalle.
Dos decisiones con tan pocos valores solo pueden producir catorce estructuras, y los 246 anuncios usan trece. Ese no es el hallazgo; un instrumento así de grueso encontraría repetición en un montón de rectángulos al azar. El hallazgo es dónde se apilan los anuncios dentro de esas catorce casillas, y qué tan lejos está eso de lo que haría el azar. Reparte 246 anuncios en catorce casillas al azar y la más llena tendría unos veinticinco. La más llena aquí tiene sesenta y ocho. Las dos más llenas tendrían unos cuarenta y ocho entre las dos. Aquí tienen 108.
Mira primero
FIGURA 1 · Comida rápida.
12 marcas · 24 anuncios · Meta Ad Library · Estados Unidos · solo anuncios gráficos, sin video.
Cada marca tiene dos anuncios y dos bandas. La de arriba es el anuncio tal como lo capturé. La de abajo es la estructura: un rectángulo gris donde va la imagen, uno negro donde van las palabras, dibujados del anuncio y de nada más. No puede contener color, tipografía, empaque ni una cara, así que no sirve para casi nada, y nada de lo que dejé fuera se puede leer de vuelta en él. Lo que contiene es la única pregunta que estoy haciendo: qué tan seguido el siguiente anuncio está armado igual que el anterior. Lee primero la banda de arriba, las doce marcas. Después lee la de abajo y fíjate en lo poco que cambia.
Doce cadenas que compiten entre sí y no comparten más restricción que vender comida rápido. Diecinueve de los veinticuatro anuncios dejan que la foto llene el cuadro. Quince de ellos, de nueve cadenas distintas, ponen las palabras arriba, centradas, sobre esa foto. Cinco de los veinticuatro están armados de cualquier otra manera.
Aquí está la cuenta
Empieza con la rejilla que acabas de leer. Quince de los veinticuatro anuncios de comida rápida son una sola estructura, de nueve marcas distintas; si sumamos la segunda más usada, diecinueve de veinticuatro.
Aquí van las diez, contadas de la misma manera. Cada categoría tiene entre once y trece marcas y entre veintiún y veintiséis anuncios; la primera columna es cuántos de esos anuncios comparten la estructura más usada, la segunda de cuántas marcas distintas vienen esos anuncios, y la tercera suma la segunda estructura más usada a la primera.

El final de esa tabla es el contracaso, y está aquí en vez de afuera. La estructura más usada en seguros de auto son cinco de sus veintiún anuncios, de cuatro marcas. Escuelas de negocios y moda están apenas arriba. Tres de estas diez categorías se reparten entre las trece estructuras en lugar de apilarse en una, y salieron de la misma cuenta que las siete que sí se apilan.
FIGURAS 2–5 · Las otras cuatro categorías de Instagram. Mismas dos bandas, mismo orden de lectura que la figura 1.
2 · Banca. 11 marcas · 22 anuncios.
3 · Automotriz. 12 marcas · 24 anuncios.
4 · Seguros de auto. 11 marcas · 21 anuncios.
5 · Moda. 13 marcas · 26 anuncios.
Automotriz, en la figura 3, converge en otra cosa. Nueve de sus veinticuatro anuncios comparten la estructura de la comida rápida, foto llenando el cuadro y palabras arriba, pero en lo que doce marcas de carros están de acuerdo es en la foto. Diecisiete de los veinticuatro dejan que la imagen sangre por los cuatro bordes. Siete no llevan ni una palabra dentro del cuadro: una camioneta en una carretera, un nombre en la esquina si acaso, y nada más. Donde la comida rápida se pone de acuerdo en dónde van las palabras, automotriz se pone de acuerdo en que la foto es el anuncio.
La mitad de los 117 anuncios de Instagram están en tres estructuras. Al azar, la más llena de catorce casillas tendría unos catorce de 117; la más llena aquí tiene treinta y uno. Y la casilla más llena es la misma en cuatro de las cinco categorías de Instagram: palabras cruzando arriba, al centro. Solo moda se apila en otro lado.
Un cliente que mira la rejilla de su propio sector lo explica por el sector: así se anuncian los bancos. Cuatro categorías de cinco apilándose en la misma casilla dicen que el sector no es lo que decide.
Moda se afloja, y esta es la razón. Trece de sus veintiséis anuncios no llevan palabras dentro del cuadro. Revisé cada uno buscando letra chica escondida en una esquina; lo que hay escrito es un logotipo y nada más. La categoría que se escapa se escapa sin decir nada.
FIGURAS 6–10 · LinkedIn. Otra vez las mismas dos bandas, cinco industrias.
6 · Ciberseguridad. 13 marcas · 26 anuncios.
7 · SaaS B2B. 13 marcas · 26 anuncios.
8 · Escuelas de negocios. 13 marcas · 26 anuncios.
9 · Medios financieros. 13 marcas · 25 anuncios.
10 · Software de RR. HH. 13 marcas · 26 anuncios.
El mismo ejercicio en la otra plataforma, en sus propios términos. Ciento veintinueve anuncios, sesenta y cinco marcas, cinco industrias, y la mitad de los 129 en dos estructuras. Al azar la casilla más llena tendría unos quince de 129; aquí tiene cuarenta y siete, y es también la casilla más llena en cuatro de las cinco categorías de LinkedIn. Mira en particular la rejilla de SaaS: palabras arriba, centradas, y una imagen enmarcada debajo, una captura de pantalla, una ilustración, una foto de gente en una mesa. Esa sola estructura son diecisiete de veintiséis anuncios y no es de nadie. Airtable, Asana, Atlassian, Databricks, Figma, HubSpot, Miro, Notion, Slack, Zoom y monday.com están todas adentro. Once empresas que compiten por los mismos presupuestos, y diecisiete de sus veintiséis anuncios armados de una sola manera.
Al azar, veintiséis anuncios repartidos en catorce casillas pondrían cuatro o cinco en la más llena. SaaS pone diecisiete. Esa es la fila más fuerte del estudio, y está en LinkedIn, no en Instagram. Las dos plataformas coinciden en dónde van las palabras y discrepan en la imagen. En Instagram la estructura más usada es una foto llenando el cuadro con las palabras arriba: treinta y uno de 117 anuncios. En LinkedIn es una imagen enmarcada dentro del anuncio con las palabras arriba: cuarenta y siete de 129. El mismo gesto, distinto contenedor. Júntalas y 108 de los 246 anuncios, de las diez industrias sin excepción, ponen sus palabras arriba del cuadro y al centro.
Dibuja una estructura una vez y las rivales se forman adentro
FIGURAS 11–20 · El censo de estructuras, uno por categoría.
Cada estructura de la categoría dibujada una vez, al mismo tamaño que los anuncios, seguida de los anuncios reales que la llenan. Las estructuras van de más a menos frecuente, aparece cada anuncio del estudio, y el orden se fija antes de dibujar, así que nada de esto es una selección.
Lee dos de estos uno al lado del otro: SaaS B2B y seguros de auto. SaaS llena su fila más larga con diecisiete anuncios de once empresas distintas. Seguros de auto no tiene una fila así en ningún lado. La más larga son cinco anuncios de cuatro marcas, y reparte veintiún anuncios en siete estructuras. La figura no muestra un molde ahí. Muestra que no lo hay.
Ese par es el contracaso, y se publica como tal. Si los únicos censos aquí fueran los siete que funcionan, la acusación justa sería que imprimí las categorías que me daban la razón.
Un atajo que hay que evitar mientras sostienes esa idea: una fila más larga corta no es lo mismo que variedad. Seguros de auto no es inventivo. Sus veintiún anuncios están repartidos en siete estructuras que todas las demás categorías también usan; simplemente no se ha decidido por una. Lo que una categoría hace en su extremo flaco no es la prueba. Una fila larga de marcas rivales lo es.
La prueba en todo el ensayo es la misma: no cuántas estructuras hay, que eso lo decide el instrumento, sino qué tan lejos están las pilas de lo parejo. Ocho de las diez categorías ponen su pila mayor en la misma casilla, palabras cruzando arriba y al centro, y en siete de esas ocho la pila es al menos el doble de lo que armaría el azar.
Fui a buscar la copia
La explicación obvia es una estructura viajando intacta de marca en marca. No está. Las dos decisiones no viajan juntas más seguido de lo que caen en la misma respuesta por separado.
Eso no reduce la previsibilidad. La explica. Estos anuncios no comparten un cuadro porque una estructura se esté pasando de mano en mano. Lo comparten porque cada decisión, tomada sola, cae en la misma respuesta mayoritaria: la imagen donde el contenedor la pone, y las palabras arriba, al centro. Dos respuestas mayoritarias seguidas producen un cuadro que se ha armado miles de veces. Cada marca llegó sola. Cada una de esas decisiones era defendible en la sala donde se tomó, que es exactamente por lo que esto es difícil de ver desde adentro.
De aquí en adelante estoy adivinando
Mirar algo no es un solo evento. Algo tiene que atrapar el ojo. Después decides si te metes. Después, si esa decisión sale bien, lees. Leer es el tercer escalón, no el primero. Tomo ese orden como premisa y no lo demuestro aquí.
Lo que creo que hace la previsibilidad es actuar sobre el primer escalón, y actuar en tu contra. Un anuncio armado igual que el anterior, y que el anterior a ese, dice lo que es antes de que nadie haya mirado nada de él. El que lo ve no necesita leer una palabra para archivarlo como anuncio, porque la construcción ya lo hizo. Y algo archivado como anuncio, por alguien que no pidió ver uno, puede perder el segundo escalón antes de llegar a él. Puede que nunca llegues a decidir si lo lees. Ya te moviste.
FIGURA 22 · Una tira de feed a tamaño de celular.
Diez anuncios, diez marcas, cinco categorías, solo Instagram, uno tras otro a tamaño de celular. Siete pantallas y pico de anuncios sin nada en medio.
Esto es una simulación, y la palabra es exacta. Sin interfaz, sin publicaciones en medio, sin movimiento, sin velocidad del pulgar. En un feed real estos diez llegarían con minutos y docenas de publicaciones de distancia, nunca seguidos, y el orden lo elegí yo. Así que no es evidencia de comportamiento. Muestra escala, y es lo único como lo que lo ofrezco.
Ocho de los 117 anuncios de Instagram eran demasiado chicos en el archivo para entrar, y cinco de esos ocho son de moda, así que moda tuvo menos elegibles aquí que las otras cuatro categorías. La figura no muestra eso.
No puedo demostrar ni una palabra de eso. No hay datos de atención en este archivo: ninguna prueba de memoria, ningún tiempo de permanencia, ninguna tasa de paso. No hay ni un solo lector en estos 246 registros. Conté qué tan previsible es la construcción. Si la construcción previsible te cuesta la parada es mi tesis, y se queda en tesis. Zanjarlo pediría algo apuntado al momento anterior a la parada, y no voy a improvisarlo para terminar un ensayo.
Pero fíjate dónde deja al oficio. Hay muchísimo ingenio escrito en estos anuncios: juegos de palabras de verdad, gracia de verdad, líneas por las que alguien peleó en una reunión. Todo eso vive en el tercer escalón. Si el primero no pasa, nada de eso se alcanza nunca, y el titular más ingenioso de la categoría es funcionalmente idéntico al más soso. Esa es la parte que más me cuesta sacudirme, porque el esfuerzo es real y se está gastando al final de una secuencia que puede detenerse al principio.
Una cosa sobre mi propia muestra
La biblioteca de Meta ordena lo que te muestra por cuánto se gastó, no por fecha, y no hay manera anónima de pedirle los anuncios más recientes. Así que la mitad de Instagram de esto son los anuncios en los que estas marcas pusieron más dinero. Ese orden empuja a las cinco categorías de Instagram hacia lo que el algoritmo esté amplificando, e infla el parecido entre marcas más que dentro de cada una. Lo que sobrevive es más angosto: entre los anuncios en los que estas marcas más gastan, la construcción converge, y esos son los que la gente de verdad vio. Así que no puedo escribir que marcas sin relación llegan por su cuenta a la misma estructura. Eso afirma independencia, y el orden por gasto la rompe en la mitad del estudio. Los cinco conjuntos de LinkedIn vienen por fecha y no cargan con esto, y la fila más fuerte del estudio es uno de ellos.
Y estos son los anuncios visibles en dos bibliotecas durante unos pocos días. Los archivé para que las figuras se puedan volver a dibujar, pero aquí no hay ninguna línea de tendencia.
Y después esto se vuelve material de entrenamiento
Una gramática así de angosta no es solo una descripción de cómo se ve la publicidad hoy. Es una descripción de con qué se están entrenando las herramientas, y ahí es donde creo que esto empeora en vez de mejorar.
Primero, una línea que no voy a cruzar. No puedo decirte que las herramientas generativas causaran nada de esto. No hay línea base anterior a 2022 en ninguna de las dos bibliotecas, no hay manera de preguntar cómo se veían las mismas diez industrias en 2019. Hasta donde este archivo sabe, SaaS estaba reducido al mismo puñado de estructuras hace una década y nada se ha movido. Quien te enseñe un número como el mío como prueba de que la igualdad es de las máquinas te está vendiendo un cuento que mis datos no contienen. Ni siquiera puedo decirte cuánto de lo que capturé fue generado: un anuncio de los 246 está visiblemente hecho a máquina, y eso es un conteo de fallas visibles, no una tasa de uso. La IA está en esta pieza como pregunta hacia adelante.
Un modelo reproduce la distribución que le mostraron. Entrénalo con esto, pídele un anuncio, y espera el cuadro que lo domina. Eso no es un defecto; es el modelo funcionando. El modo de falla que preocupa a la gente es que el modelo haga algo raro. Al que yo le apostaría es a que el modelo haga algo extremadamente normal, con seguridad, en volumen, a pedido.
Y hay un resultado que hace que la dirección hacia adelante se vea peor que una simple copia. Alemohammad y colegas, en ICLR 2024, entrenaron modelos generativos con su propia salida a lo largo de generaciones y separaron dos casos. Dejados solos, calidad y variedad se degradan las dos y las muestras se vuelven ilegibles. Pero sesga el muestreo hacia las salidas más típicas, el dial que los autores usan en lugar de la selección a mano que hace todo pipeline real, y la calidad aguanta mientras la variedad se desploma más rápido. El resultado sigue viéndose bien todo el camino hacia abajo. Sus modelos son caras y dígitos escritos a mano, sin ningún modelo de texto a imagen ni publicidad a la vista, así que estoy tomando prestada una forma y no una medición.
Pero la forma es lo que importa. Un pipeline que selecciona por «esto se ve como un buen anuncio» está seleccionando sobre el tercer escalón. Está eligiendo lo que esté mejor terminado. Nada en ese bucle selecciona por el primer escalón, porque el primer escalón es precisamente lo que un humano revisando opciones en un escritorio, con toda su atención, no puede sentir. Así que lo que se gasta es lo que ya escaseaba.
El contracuento tranquilizador necesita el mismo cuidado. La gente dice que el colapso del modelo se evita si los datos se acumulan en vez de reemplazarse, y para lenguaje eso es lo que muestra la evidencia. Para imágenes, el mismo artículo que lo estableció dice lo contrario con todas sus letras: acumular los datos hizo crecer el error ronda tras ronda, con la variedad bajando y el modelo soltando primero los casos raros (Gerstgrasser et al., COLM 2024). El seguimiento que suele citarse como confirmación no contiene ningún modelo de imagen.
Los dos casos que alguien ha documentado de una forma filtrándose desde un pipeline de entrenamiento no son el mío: los dos fueron un script aplicando una transformación a cada imagen del conjunto de entrenamiento (Corvi et al., 2023; SDXL, 2024). El mío es una regularidad del contenido, puesta ahí por directores de arte un anuncio a la vez, y no pude encontrar un solo caso documentado de ese tipo. Nadie lo ha medido. Eso es peor para la versión fácil de mi argumento y mejor para la pregunta.
Y la gente hace esto sin ninguna máquina de por medio. El único estudio controlado que encontré sobre diseñadores a los que se les mostraban ejemplos antes de bocetar tenía una tercera condición que nadie cita: el grupo al que le mostraron resultados de Google Imágenes se trabó igual que el grupo de IA, y produjo menos ideas y más parecidas (Wadinambiarachchi et al., CHI 2024). Los autores son cuidadosos donde su propio resumen no lo es: llaman insignificantes a los efectos sobre la originalidad y se niegan a afirmar significación. Que te muestren ejemplos estrecha lo que haces. Eso no es un hecho sobre los modelos generativos. Es un hecho sobre los ejemplos, y este archivo es una pila muy grande de ejemplos, la lea una máquina o la lea una persona.
La mejor respuesta a todo esto, y no la puedo vencer
Las señales de tránsito se parecen a propósito. Una señal de alto que expresara la identidad visual de su municipio sería una peor señal de alto.
Una estructura previsible puede ser un activo. Si el ojo ya sabe leer este cuadro en este contenedor, nada del esfuerzo del que mira se va en ubicar las palabras y todo se va en lo que las palabras dicen. Previsible y legible son la misma propiedad descrita por alguien a quien le gusta y alguien a quien no. En esa lectura, la convención está comprando comprensión, y una marca que la rompe la paga en comprensión.
Lo único que respondería es que toda la defensa es un argumento sobre el tercer escalón. Describe lo que pasa una vez que alguien está leyendo. No tiene nada que decir sobre si empezó, y ese es el escalón que creo que la convención está gastando. Decidir entre esa lectura y la mía necesita una medida de efecto, y no hay ninguna en ningún lado de estos 246 registros.
Lo que haría yo de verdad al respecto
No esperaba terminar aquí, y quiero ser cuidadoso, porque un ensayo que cuenta estructuras no se ha ganado el derecho a decirle a nadie cómo ser creativo.
Lo que sí se ganó es una descripción del bucle. Diez industrias que no tienen nada que ver entre sí, siete convergiendo fuerte, y la más apretada de esas con diecisiete de sus veintiséis anuncios en una sola estructura: once empresas de software, operando por su cuenta y compitiendo entre ellas, veintiséis anuncios entre todas. Nadie copió a nadie. Cada una de esas decisiones era la sensata, defendida con buenas razones, aprobada por gente haciendo bien su trabajo. Así se ve un bucle desde adentro: no flojera, sino muchísima gente razonable llegando a la respuesta mayoritaria dos veces seguidas.
Y el bucle tiene un motor nuevo ahora, que es la parte que me movió de notar a escribir. Estamos a punto de automatizar la respuesta mayoritaria, entrenada con un registro de la respuesta mayoritaria y revisada por gente mirando el acabado en vez del arranque. La variedad se va primero y la calidad aguanta, así que no se va a sentir como declive. Se va a sentir como que todo está bien.
Así que el argumento a favor del riesgo no es que lo distinto sea mejor. El argumento de la legibilidad bien puede tener razón. El argumento es más angosto y más difícil de discutir: el costo de la convención se puede contar hoy, y el costo de apartarse de ella no. Uno de esos dos números existe. Si los estás pesando como si los dos fueran conocidos, estás pesando un costo medido contra uno imaginado, y eso no es prudencia. Es solo el bucle con una justificación encima.
Y si el orden es el que creo, entonces el riesgo está en el lugar equivocado. Estamos gastando el valor en la línea, en lo que alguien va a admirar en la presentación, todo en el tercer escalón y todo aguas abajo de una parada que puede no ocurrir. La implicación incómoda de mi propia cuenta es que lo más valiente del archivo no es el titular más ingenioso. Es aquel de estos 246 que se armó fuera de la pila en la que cayó su categoría. Hay menos de esos de lo que la tabla sugiere, y no puedo decirte si uno solo de ellos funcionó.
Cinco preguntas antes de aprobar la estructura
Cinco preguntas que vale la pena poner en un brief, o hacer en la sala antes de que alguien firme dónde van las palabras y la imagen.
¿Dónde cayeron las palabras, y lo decidió alguien, o simplemente se fueron arriba? Ocho de las diez categorías de este archivo ponen su pila mayor en el mismo sitio, las palabras cruzando arriba al centro. Si nadie en la sala lo eligió, lo eligió el contenedor por ti.
Quita el logo. ¿De quién es este anuncio ahora? Pon el cuadro al lado de los de tus dos competidores más cercanos con las marcas tapadas. En SaaS, diecisiete de veintiséis anuncios de once empresas pasan esa prueba reprobándola.
¿Cuál de las dos decisiones estamos tomando de verdad? El tratamiento de la imagen lo fija casi siempre la plataforma, a sangre en Instagram y enmarcada en LinkedIn. Queda una decisión que sigue siendo tuya, y es la que todo el mundo toma igual.
¿El ingenio está en la línea, y la línea está en el tercer escalón? Todo lo escrito vive detrás de una parada que esta estructura puede no producir nunca. Pregunta qué dice el anuncio antes de que alguien haya leído una palabra.
¿Cuánto costaría ser el único anuncio del conjunto armado distinto, y alguien en la sala le puede poner un número? El costo de la convención se puede contar hoy. El costo de dejarla, no. Si los dos se están pesando como conocidos, uno de ellos es inventado.
Fuentes
Cinco artículos, los cinco leídos enteros, los cinco con revisión por pares. Ninguno va de publicidad, ninguno va de estructura, y ninguno mide lo que yo estoy preguntando. Están para marcar dónde se acaba la evidencia. Todas las cifras sobre los anuncios son mías.
Corvi, R., Cozzolino, D., Poggi, G., Nagano, K. y Verdoliva, L. (2023). «Intriguing properties of synthetic images: from generative adversarial networks to diffusion models». CVPR Workshops 2023, 7th Workshop on Media Forensics, pp. 973-982. arXiv:2304.06408. El caso del JPEG Q=75 y el contraste con ImageNet, §4.
Podell, D., English, Z., Lacey, K., Blattmann, A., Dockhorn, T., Müller, J., Penna, J. y Rombach, R. (2024). «SDXL: Improving Latent Diffusion Models for High-Resolution Image Synthesis». ICLR 2024 (spotlight). arXiv:2307.01952. DOI 10.48550/arXiv.2307.01952. El condicionamiento del recorte, §2.2, p. 5; el límite de 64 píxeles del bucket, §2.3, p. 7. El resultado del recorte lo sostienen las figuras 4 y 5, sin N y sin tamaño de efecto.
Alemohammad, S., et al. (2024). «Self-Consuming Generative Models Go MAD». ICLR 2024 (póster). arXiv:2307.01850. DOI 10.48550/arXiv.2307.01850. El resultado del sesgo de muestreo, §3.4, pp. 9-10, figuras 6 y 7. Modelos: StyleGAN-2 sobre FFHQ a 128², DDPM sobre MNIST. Ningún modelo de texto a imagen.
Gerstgrasser, M., Schaeffer, R., Dey, A., Rafailov, R., Korbak, T., Sleight, H., Agrawal, R., Hughes, J., Pai, D. B., Gromov, A., Roberts, D., Yang, D., Donoho, D. L. y Koyejo, S. (2024). «Is Model Collapse Inevitable? Breaking the Curse of Recursion by Accumulating Real and Synthetic Data». COLM 2024. arXiv:2404.01413. DOI 10.48550/arXiv.2404.01413. El resultado de imagen, §2.3, p. 7. El experimento de imagen es un VAE sobre CelebA.
Wadinambiarachchi, S., et al. (2024). «The Effects of Generative AI on Design Fixation and Divergent Thinking». CHI '24, artículo 380, pp. 1-18. DOI 10.1145/3613904.3642919. Las tres condiciones y el control de Google Images, tablas 2 y 3. El estudio es bayesiano y se niega a afirmar significación.